Soil moisture monitoring tells you when plants need water and when they can wait. Sensors at active root zones turn soil behavior into clear signals you can act on. A clean install reads the root zone, not the weather above it: firm contact, sealed holes, and secured leads. You start to see patterns – dark, even wetting after irrigation, crust that lingers on tired spots, infiltration that slows where soil is compacted. That picture turns watering into deliberate moves made on schedule, not hunches. Make a small change, watch the trend, and let the bed reply before touching timers again. The payoff is fewer stressed afternoons, tighter control over water use, and a garden that holds its rhythm through wind and heat.
Key Takeaways:
- Detect hidden stress before wilting shows in afternoon light
- Trigger changes only when 3-day averages cross your band
- Avoid surface-biased placement that reads weather, not roots
- Check sensors every 7 days, archive monthly trend snapshots
- Build water savings by acting once, then letting beds respond
Table of Contents
Soil Moisture Monitoring – What to Measure and Where to Place
Good readings come from the right metric at the right depth. Measure where roots actually drink, not where sun bakes the surface, and stabilize the install so numbers track plant demand.
Pick your metric – volumetric water content vs tension
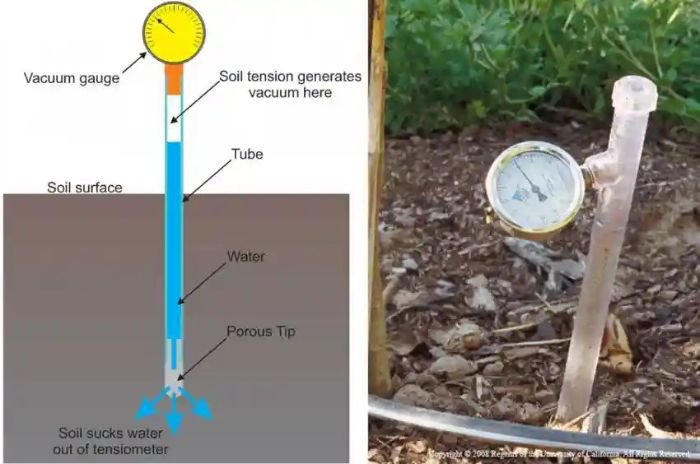
Choose volumetric water content (VWC) when you want frequent percentage readings and trend lines for beds, rows, and containers. Capacitance probes respond quickly after irrigation and suit most home soils, including loams and light clays. Use soil tension (kPa) when you need to know how hard roots pull for water, which is helpful in coarse sand or raised beds that drain fast. Tensiometers shine in the 0-80 kPa range and flag stress early as values climb. If a site has salinity from fertilizers or reclaimed water, VWC probes with salinity compensation handle the signal better than bare-resistance types.
Locate active roots, then place sensors accordingly
Match depths to the planting, not a one-size target.
- Annual vegetables and mixed flowers – shallow sensor at 4-5 inches, deeper sensor at 6-7 inches for upper and lower layers
- Shrubs and young trees – top sensor at 5-6 inches under canopy edge, lower sensor at 8-9 inches just inside dripline
- Row crops with drip tape – probe midway between two emitters, offset 2-3 inches sideways to avoid saturation skew
- Containers – probe one third of the way down and one third in from the wall to reduce edge effects
- Stagger sensors so hand tools and mulch refreshing do not disturb placement
Pro tip: On slopes, install on the uphill side of a plant to avoid extra moisture from downslope seep.
Seal and stabilize the install
A good install removes air gaps and keeps the probe in firm contact with native soil. Pre-drill a hole just large enough for the sensor body, then backfill around it with a thin slurry of the same soil to bond surfaces; do not use potting mix as a filler. Gently tamp the top inch to match surrounding firmness so water does not route down along the cable. For wired probes, create a small drip loop and secure the lead to a stake so wind and maintenance do not tug the sensor loose. Allow 24 hours after installation or major disturbance before trusting numbers so the soil can resettle and equilibrate.
Placed well and measured with the right metric, sensors tell a true story about root-zone moisture and set you up for precise irrigation decisions later.
Choose the Right Soil Moisture Sensor for Your Garden
Pick hardware by soil texture, layout, and how much data you will actually use. A good match saves time later, keeps readings stable through the season, and makes irrigation changes straightforward.
What is a soil moisture monitoring system
A soil moisture monitoring system is a probe that measures moisture, a logger that stores or transmits data, and a power source with weather protection. Expect update intervals between 15-60 minutes, enough for trend lines without draining batteries. Outdoor nodes should carry at least an IP65 rating and operate across about -4 to 122°F. For wired setups, strain-relief on cables matters more than brand; wind and tools tugging on the lead cause silent drift long before a sensor fails outright.
Pro tip: Name zones and sensors at install so logs stay readable when you add more nodes later.
Best way to monitor soil moisture in home gardens
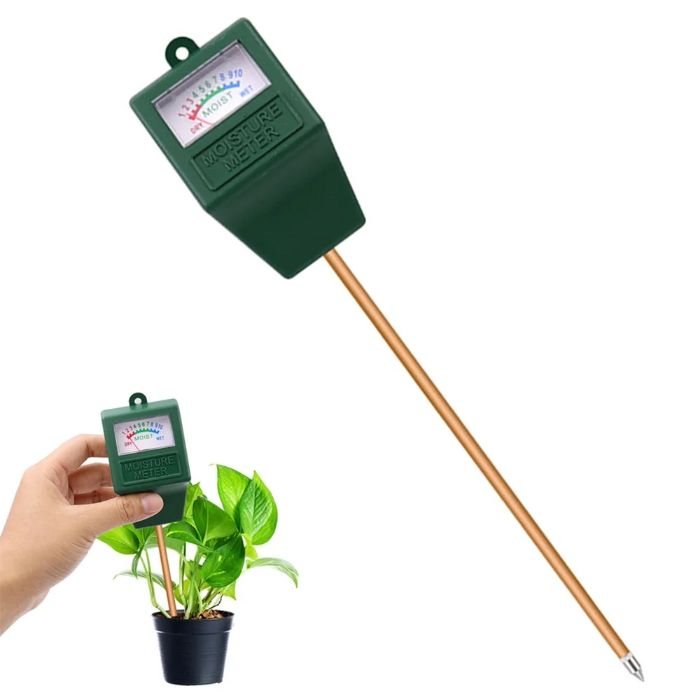
Choose by decision rules, not brand names. If you need frequent trend data across mixed beds, use a capacitance VWC probe tied to a simple logger. If you work in coarse sand that sheds water, a tensiometer shows plant effort directly and catches stress early as tension rises. For containers and small beds, a handheld soil moisture meter is fine for spot checks when you use the same insertion depth and location each time. If you want alerts without walking the beds daily, a wireless node with a weekly battery check closes the loop. Match probe length to target root depth and keep the sensing area in undisturbed native soil.
Avoid common accuracy traps
Three problems skew readings more than anything else: salinity, temperature swing, and poor soil contact. Fertilizer salts can depress VWC readings on basic resistive designs; choose capacitance probes with salinity compensation where you fertigate or use reclaimed water. Temperature swings of more than 20°F in a day move readings on exposed probes; shade the head and loggers, or use devices with onboard temperature correction. Air gaps from loose auger holes cause false lows; install snug, backfill with a thin slurry of the same soil, and let the site rest 24 hours before trusting numbers.
| Type | Metric | Response speed | Maintenance | Best use cases | Typical errors |
|---|---|---|---|---|---|
| Capacitance VWC probe (wired) | VWC | Minutes | Low | Mixed beds, rows, containers | Air gaps, cable tug |
| Wireless VWC node | VWC | Minutes | Low-Medium | Remote beds, alerts | Battery drop, radio dropout |
| Tensiometer | Tension (kPa) | Minutes-hours | Medium | Sandy or fast-draining soils | Drying beyond range, air entry |
| Gypsum/resistance block | Tension proxy | Hours-days | Low | Budget trend tracking | Salinity bias, slow response |
| Handheld pin meter | VWC proxy | Immediate | Low | Spot checks, houseplants | Inconsistent depth, edge effects |
Pick one system you will maintain. A stable, well-placed sensor that you scan weekly beats a complex network you stop checking by midsummer.
Install and Calibrate a Soil Hygrometer and Probes
Calibration makes numbers usable. Set up a simple routine that places sensors where roots actually draw water, records a clear “full” reference, then validates trend stability before you act on alerts.
Placement pattern by zone
Plan sensors as pairs so you see the upper and lower parts of the root zone without chasing extremes. In mixed beds, place one probe near the canopy edge of a representative plant and a second probe midway between emitters or sprinkler passes:
- In rows, use a repeating pattern – one probe inline with the crop band and a second offset laterally to catch the drier shoulder.
- On slopes, place sensors on the upslope side of a plant and repeat the pair in the mid-slope to avoid extra seep at the toe.
- Containers read cleanly with one probe set roughly one third of the depth from the surface and one third in from the pot wall; add a second probe only for large tubs or rapid-drying mixes.
Label each location at install so logs stay interpretable months later.
Set a baseline with a field-capacity check
Create a “full” mark by running a normal irrigation event and then waiting long enough for free drainage to taper off; in most garden soils that is 12-24 hours. Record the stabilized reading from each probe as your field-capacity reference. Next, allow a controlled drydown with irrigation paused; watch for the point where readings begin a steady, day-over-day decline. Mark that value as the start of actionable drying for that soil and rooting depth. For containers, a quick alternative is to weigh a pot at full and again at your “water-again” point to understand how much moisture leaves the medium between those two states. A handheld soil hygrometer can spot-check that the container reading aligns with your in-ground trend.
Validate and log trends
Before you trust alerts, validate that the system repeats. Run one normal week without changing irrigation. Readings should rise after watering, flatten overnight, then drift downward on off days in a consistent pattern. If one probe shows wild swings while its neighbor stays steady, check contact, cable strain, or shading on the head unit. For a wireless soil moisture sensor, confirm that transmission intervals and battery voltage hold steady across several days; gaps or voltage dips often masquerade as moisture shifts. Archive daily highs and lows for each probe so you can spot sensor drift later.
- Map representative plants and bed zones before placement
- Pair sensors to read upper and lower root layers
- Record stabilized “full” values after 12-24 hours
- Log a week of trends before enabling alerts
- Tag probes and keep a simple zone legend
With a clear baseline and a clean week of trends, every reading ties back to real plant demand, which makes irrigation changes straightforward and low-risk.
Use Soil Moisture Monitoring to Set Irrigation
Numbers guide runtime better than habit. Translate readings into texture-aware trigger points, make small changes, then hold steady long enough to see a clean response before touching settings again.
What is a good soil moisture percentage
Good targets depend on soil texture. Re-water sandy profiles when volumetric water content drops into the 8-12% band, which usually aligns with 10-20 kPa on a tension scale. Sandy loams run well at 12-18% or roughly 20-30 kPa. Loams stay stable at 18-25% or around 30-45 kPa. Clay loams favor 25-35% and about 45-70 kPa. If a bed mixes textures, lean toward the tighter range and verify that plants do not stall midday. Tension thresholds respond consistently across salts and fertilizers; percentage probes give faster trend data after irrigation events. Use the metric you installed, then keep to the matching trigger range.
| Texture | VWC re-water range (%) | Tension range (kPa) | Notes |
|---|---|---|---|
| Sand | 8-12 | 10-20 | Fast drain, shallow storage |
| Sandy loam | 12-18 | 20-30 | Quick uptake, moderate hold |
| Loam | 18-25 | 30-45 | Balanced storage and aeration |
| Clay loam | 25-35 | 45-70 | Slow intake, long hold time |
Small deviations are normal day to day. Decide based on repeat dips into the range, not single spikes after wind or heat.
Move in measured steps
Change irrigation in 10-20% increments, then wait one full cycle to see how the curve shifts. If readings rebound above the upper band and stay there for 48 hours, trim the same amount. If the line keeps sliding into the lower band within 24 hours, add another 10% and recheck. For slopes or tight soils, split runtimes into two shorter sets so moisture can move down between passes without surface loss. When containers fall through the band within a single day, shorten intervals before you add more minutes.
Track trends and prevent oscillation
Trends matter more than any single datapoint. Use a 3-day rolling average to decide changes and apply a hold period of 48-72 hours before the next adjustment. Add hysteresis so alerts stop chirping: for percentage probes, trigger at the lower edge and silence only after readings climb 2-3 points above it; for tension, clear alerts once values drop 5-10 kPa under the threshold. A sawtooth pattern that never settles often means runtimes are too short; lengthen sessions slightly and widen the alert gap.
Tying decisions to clear bands, modest adjustments, and short hold periods keeps irrigation stable and plants growing on schedule without wasted water.
Troubleshoot Drift and Maintain Sensor Accuracy
Accurate numbers depend on stable contact, clean signals, and steady power. A short diagnostic routine catches problems early and keeps decisions tied to real soil conditions.
Reading drift and how to correct it
Drift shows up as values creeping wetter or drier without matching weather or irrigation. If one probe swings while a nearby probe stays steady, suspect contact or local salts. Re-seat the sensor by lifting it just enough to break the gap, then press back into a snug hole and firm the top layer so runoff does not track down the cable. After heavy fertigation, pause feed for one cycle and flush with plain water; recheck after 24-36 hours. For capacitance probes, a persistent offset larger than 3 VWC points over two days calls for a baseline check after a normal refill. For tensiometers that stall high, purge air, refill with degassed water, and confirm the instrument returns smoothly through 10-40 kPa after irrigation. A flatline at the same number typically means a loose connector or water in the housing, not a perfectly stable bed.
Power, firmware, and connectivity checks
Weak power looks like random dropouts or late packets, not just low battery icons. Swap cells when voltage falls below the maker’s mid-range threshold, often around 20-30% remaining, and keep spares dry and cool. Mount antennas above mulch and away from metal edging; foliage density and wet canopies cut range on humid mornings. Update firmware during a dry window and log the version so later changes have context. For wired installs, protect connections inside an IP65 box, add a drip loop, and check for green corrosion or crushed jackets after edging work. If radio distance is marginal, reposition the gateway first before raising transmit power, which shortens battery life.
Seasonal service plan
Service beats recalibrating under stress. Do a spring commission, a midsummer check, and a fall closeout. Spring: verify placement marks, confirm a stable post-irrigation plateau, and replace worn gaskets. Midsummer: brush soil off housings, check strain relief, and compare each probe to a portable reference; a delta over 2-3 VWC points or 8-12 kPa merits re-seating. Fall: pull shallow container probes, dry and store them, and archive season logs to a simple spreadsheet so next year starts with known baselines.
- Swap batteries at 20-30% and record dates
- Inspect cables and seals after bed work
- Re-seat sensors showing persistent offset
- Update firmware during stable weather
- Archive logs at season change
A predictable maintenance rhythm keeps readings trustworthy, which makes irrigation tweaks smaller, fewer, and safer for plant roots.
Closing Notes
Treat soil moisture monitoring as a tight control loop. Define a floor and a ceiling for each zone that differ by 3-5 VWC points or 12-18 kPa, then act only when the 3-day average crosses those boundaries. After any change, hold settings for 72 hours so roots respond and readings stabilize before you touch timers again.
Use clear triggers to avoid chasing noise. If the average dips below the floor twice within 5 days, add 8-12% runtime or split the session into two shorter passes. If the average sits above the ceiling through two checks, trim 8-12% and recheck. A flat line that ignores weather usually means a power or contact issue; a jagged up-down pattern often points to runs that are too short or alerts that reset too close to the boundary.
Lock in a cadence. Scan dashboards quickly after morning irrigation, review trends once a week, and service hardware at the start of each month. Before a heat wave or a multi-day rain, widen the deadband by 2 VWC points or 6-8 kPa so alerts stay meaningful while conditions swing.
- Set per-zone floor and ceiling values
- Decide by 3-day averages, not single points
- Hold adjustments 72 hours before re-tuning
- Inspect sensors after any bed disturbance
- Archive monthly trends for seasonal reset
FAQ
How many sensors do I need per zone for reliable readings?
Use one paired install (upper and lower root layer) for small beds up to 150 sq ft; add another pair for each additional 150-200 sq ft. In long rows, repeat a pair every 20-30 ft. Large containers benefit from one probe per 10-15 gallons; very big tubs may need two at different depths.
Should I move sensors during the season or leave them in place?
Leave sensors put for trend continuity and move them only after a major canopy change, a bed rework, or when roots clearly extend beyond the probe’s sensing zone. After any move, re-seat firmly, wait 12-24 hours for readings to stabilize, and log new baseline values.
After a heavy rain, when should I resume irrigation?
Wait for a stable post-storm plateau, then resume when readings drop 2-3 percentage points from that plateau or when tension rises 5-10 kPa. In loams this often takes 24-48 hours; sands recover sooner and tight clays hold longer.
Can fertigation or reclaimed water distort moisture readings?
Salts can skew resistive probes and slow their recovery after feeding. Flush with plain water for one cycle after liquid fertilizer, then compare next-day readings to pre-feed levels. Where salinity runs high, use a probe with salinity compensation and confirm stability over two calm days before changing runtimes.
Is one handheld meter enough to manage multiple beds?
A handheld unit works for spot checks if you sample the same locations and depths every time and record values on a fixed weekly cadence. For unattended trends, anchor at least one permanent probe in the thirstiest zone and use the handheld to audit the rest.
Why do readings look fine while plants still wilt at midday?
Readings can be accurate while roots face heat load, compaction, or hydrophobic pockets. Check contact and placement, verify that the sensing zone overlaps active roots, and run two shorter cycles on compacted spots to improve infiltration. If tension barely changes while plants flag, inspect for root issues or poor aeration.
How do I power and protect a wireless node through summer?
Use fresh lithium AAs where heat or cold swings are common, mount the antenna above mulch with a clear line to the gateway, and swap batteries at 20-30% before dropouts start. Keep electronics in an IP65 box with a drip loop, and recheck signal after heavy pruning or leaf-out that can block radio paths.