Last Updated June 08, 2026
A crop health dashboard can look impressive and still miss the field problem. Under a dense canopy, early leaf wetness risk may hide beneath a green satellite map. Disease detectors often see spotted leaves after infection has spread. Regional humidity alerts can miss low fields that stay wet for hours longer than the nearest station.
Predictive analytics for crop health works when data turns into an earlier field decision. The system should estimate disease risk, stress risk, pest pressure, scouting priority, or intervention timing before a visible outbreak becomes expensive. The useful output is a risk score tied to a field, crop stage, disease target, confidence level, and action window.
Crop health prediction is a monitoring loop. Collect weather, canopy, soil, image, scouting, and management data. Convert those inputs into risk signals. Send alerts only when they change the next scout, irrigation check, spray decision, or cultural response. Then compare the prediction with field observations so the model improves instead of drifting away from reality.
Key Takeaways
- Predictive analytics should trigger a crop health action: scout, sample, ventilate, irrigate, protect, delay, or investigate.
- Satellite and drone imagery can prioritize fields; ground scouting confirms symptoms and supplies model labels.
- A risk score is more useful when it includes lead time, confidence, threshold, and the cost of false alarms.
- Model validation should respect season, location, crop, disease, and field boundaries.
- Predictive systems support integrated crop management alongside agronomic judgment and lab diagnosis.
Table of Contents
Start With The Crop Health Decision The Model Must Trigger
The first design choice is the decision. A disease-risk forecast for tomato late blight needs a different model from a greenhouse gray mold alert, a corn nitrogen-stress map, or a field-level scouting route. Each decision has a crop, a disease or stress target, a lead time, a spatial scale, and a response.
Write the decision in operational language before choosing software: “Flag strawberry blocks with high gray mold risk 24 to 48 hours before scouting.” That sentence sets the crop, problem, lead time, block scale, and action. It also stops a common failure: collecting broad crop-health data before the decision is defined.
| Crop Health Decision | Predictive Target | Useful Lead Time | Action It Should Trigger |
|---|---|---|---|
| Disease scouting priority | Field or block disease-risk score | Same day to 3 days | Send scouts to the highest-risk zones first |
| Fungicide timing support | Infection-risk threshold or disease-favorable weather window | 1 to 5 days | Review label, crop stage, weather, and IPM threshold before treatment |
| Greenhouse disease prevention | Humidity, VPD, leaf wetness, and temperature risk | Hours to 2 days | Adjust ventilation, heating, spacing, irrigation timing, or sanitation |
| Remote field stress detection | Canopy stress anomaly from imagery and weather | Days to weeks | Inspect irrigation, pests, nutrition, compaction, or disease |
| Regional outbreak watch | Risk spread by weather, crop distribution, and reports | Several days to weeks | Increase monitoring and adjust prevention plans |
Machine learning yield forecasting asks what the crop will produce. Crop health prediction asks which stress or disease may reduce that outcome and when action still has value.
Build The Crop Health Data Stack Around Disease Biology
Predictive analytics should start with the disease triangle: susceptible host, active pathogen, and favorable environment. Technology adds scale and timing. Weather stations capture temperature, rainfall, relative humidity, wind, and leaf wetness. Crop records add cultivar, planting date, growth stage, canopy density, rotations, and previous outbreaks. Imagery shows stress patterns. Scouting supplies ground truth.
Plant disease models describe the interaction among environmental, host, and pathogen variables, with outputs such as disease-risk indices, predicted incidence, severity, or inoculum development. That is the core logic behind modern crop health analytics, including interfaces that use AI language.
| Data Layer | What It Adds | Disease-Risk Use | Common Failure |
|---|---|---|---|
| Weather and forecast data | Temperature, rainfall, humidity, wind, solar radiation | Detects infection-favorable windows | Nearest station misses field microclimate |
| Leaf wetness and canopy humidity | Moisture duration at the crop surface | Improves fungal and bacterial risk timing | Sensor sits outside the canopy or at the wrong height |
| Soil and irrigation data | Moisture, drainage, saturation, salinity, runtime | Separates water stress from disease-like symptoms | Surface readings hide deeper root-zone conditions |
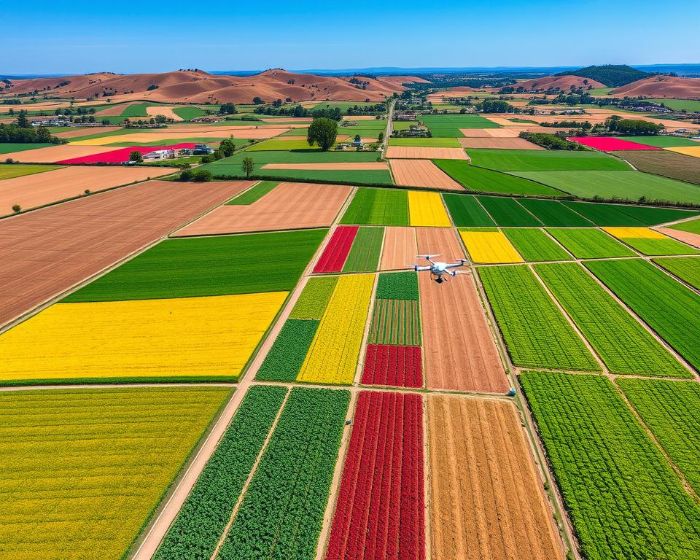
| Satellite or drone imagery | NDVI, NDRE, thermal, RGB, canopy gaps, anomaly maps | Ranks fields or zones for inspection | Cloud, shade, soil background, or growth stage creates false signals |
| Scouting and lab records | Observed symptoms, pest counts, diagnosis, severity score | Supplies labels for training and validation | Inconsistent notes make the model learn noise |
| Management records | Variety, planting date, rotation, spray, fertility, irrigation, harvest | Explains why similar fields respond differently | Missing dates weaken every later prediction |
Outdoor farms and greenhouses use different data stacks. Field systems may lean on weather, scouting, and imagery. Greenhouse systems can capture climate and crop-zone conditions at much higher frequency. IoT greenhouse climate control becomes a crop-health tool when humidity, VPD, leaf temperature, airflow, and irrigation records feed disease-risk decisions.
Turn Inputs Into Risk Scores, Alerts, And Scouting Routes
A predictive system should convert raw data into a risk level that people can act on. Some crop disease models use rules or equations. Others use regression, random forest, gradient boosting, neural networks, image models, or time-series models. Model choice should be judged by the decision quality it creates.
Plant disease models can use weather, host, and pathogen data to predict disease outbreak risk. In practice, a risk score should never travel alone. It needs a crop stage, disease target, field location, confidence level, and recommended follow-up.
| Risk Level | What The Model Is Saying | Field Response | Data To Record |
|---|---|---|---|
| Low | Conditions are outside the known risk window | Keep routine monitoring | Weather, crop stage, and normal scouting notes |
| Watch | One or more risk factors are building | Move the field higher on the scouting list | Canopy wetness, recent rainfall, and first symptom checks |
| High | Environment and host stage match the disease-risk window | Scout quickly and review IPM threshold or prevention plan | Observed disease presence, severity, and action taken |
| Critical | Risk window is active and symptoms or regional reports support concern | Confirm diagnosis and decide treatment, sanitation, or climate response | Diagnosis, product decision, weather, and follow-up outcome |
An alert should change a route or a threshold. “Crop health anomaly detected” is too broad for field action. Useful alerts name the place, crop, disease target, reason, and next field task: “Block 4 tomato canopy has high late blight risk after 18 hours of leaf wetness and mild temperatures; scout the north edge before irrigation.”
Choose Predictive Models By Data Type And Decision Scale
Predictive analytics can be simple or complex. Rule-based disease forecasts may outperform neural networks when disease biology is well understood and weather inputs are clean. Machine-learning models may help when signals come from many weak indicators across weather, imagery, field history, and scouting records.
| Model Type | Best Data Fit And Scale | Useful Output | Limit To Manage |
|---|---|---|---|
| Rule-based disease model | Known disease-weather relationship at field, block, or regional warning scale | Infection period, risk index, spray timing support | May need local calibration and correct sensor placement |
| Logistic regression or random forest | Tabular field records, weather, soil, and crop stage at field or block scale | Risk probability and ranked feature importance | Can miss time-dependent disease buildup |
| Gradient boosting | Mixed tabular data with non-linear interactions at field, block, or farm scale | Field or block risk score | Needs careful validation to avoid overfitting |
| Time-series model | Hourly or daily weather, sensor, and greenhouse logs at bay, block, or field scale | Risk trend and lead-time alert | Weak when records have gaps or sensor drift |
| Image model | Leaf images, drone RGB, and multispectral imagery at plant, row, or zone scale | Disease detection, severity estimate, stress map | May identify symptoms after infection has progressed |
| Multimodal model | Weather, imagery, scouting, crop stage, and management records across decision scales | More complete crop-health risk picture | Harder to explain and maintain |
Sequential environmental data can support disease-risk scoring. One open-access study used previous crop growth environment information such as air temperature, relative humidity, dew point, and CO2 concentration to predict crop pest and disease risk scores across crops including strawberry, pepper, grape, tomato, and paprika. The lesson for growers is practical: the model can detect risk movement from continuous conditions before a field team sees widespread symptoms.

Validate Crop Health Predictions Before Trusting Them
Validation turns crop-health predictions into field-tested decision support. Crop disease models can perform well in one crop, region, greenhouse, or season and fail somewhere else. Local disease pressure, crop variety, sensor position, irrigation style, canopy density, and scouting quality can change the result.
Plant disease models developed in specific climates and regions should be tested under local conditions before use in a new location. AI systems trained on large datasets can still look accurate while learning patterns that fail in a different field, season, crop, or sensor setup.
| Validation Check | Why It Matters | Better Practice |
|---|---|---|
| Time split | Random splits can mix the same season into training and testing | Train on older seasons and test on newer seasons |
| Field or farm split | Nearby zones can share the same disease and weather pattern | Test on fields kept out of training |
| Regional split | A humid valley and dry ridge may behave differently | Evaluate by microclimate and region |
| Ground truth quality | Poor labels teach the model poor disease definitions | Use consistent scouting forms and confirmed diagnoses |
| False positive cost | Too many alerts cause alert fatigue and wasted scouting | Track alerts that led to useful action |
| False negative cost | Missed outbreaks can be expensive | Review every surprise outbreak and update thresholds |
Validation should include the management result: earlier scouting, confirmed risk, better treatment timing, fewer unnecessary applications, and traceable outcomes. Predictive analytics earns trust when the farm can connect alerts back to crop results.
Avoid The Problems That Make Crop Health Analytics Fail

Most predictive systems fail through workflow gaps. Sensors are installed and never calibrated. Scouting labels change from one person to another. Disease alerts arrive after the spray window. A satellite map flags water stress and the team treats disease. A model trained on irrigated fields gets applied to rainfed fields with different stress patterns.
| Failure Pattern | What Happens | Fix Before Scaling |
|---|---|---|
| Unclear decision target | The dashboard reports risk with no action | Define the crop, disease, lead time, field scale, and response |
| Poor sensor placement | The model reads weather outside the crop’s actual microclimate | Place canopy sensors where model validation expects them |
| Weak scouting labels | Training data mixes symptoms, stress, pests, and disease | Use standard scouting forms and severity classes |
| Image-only prediction | Alerts may arrive after symptoms are visible | Combine imagery with weather and crop-stage risk |
| Over-automation | The system recommends actions before field confirmation | Use alerts to trigger scouting and threshold review |
| Model drift | Accuracy drops as varieties, weather, or practices change | Recalibrate with recent seasons and local observations |
Crop health analytics also overlaps with water and nutrient decisions. A disease model can overreact if water stress, clogged emitters, or nutrient deficiency create stress signatures. Irrigation data analytics helps separate root-zone water problems from disease risk, especially when canopy stress appears before symptoms are clear.
When symptoms appear, predictive analytics should feed back into diagnosis. Plant disease identification still matters because risk scores need pathogen confirmation, nutrient review, and local diagnostic support.
Conclusion
Predictive analytics for crop health is valuable when it turns scattered data into earlier, clearer decisions. Weather, leaf wetness, imagery, scouting, crop stage, and management records all matter because disease risk is biological, environmental, and local.
Strong systems begin with a decision, build the data stack around disease biology, convert inputs into risk scores, validate predictions in real fields, and keep people in the loop. When the model sends the right scout to the right field at the right time, predictive analytics becomes part of crop protection.
FAQ
What is predictive analytics in crop health monitoring?
It is the use of weather, sensor, imagery, scouting, crop-stage, and management data to estimate disease, pest, or stress risk before the problem becomes widespread. The output should support a field action such as scouting, sampling, climate adjustment, or treatment review.
Can predictive analytics predict crop disease outbreaks?
It can estimate outbreak risk when the model has the right crop, pathogen, environment, host stage, and local validation. It should be treated as decision support, with field scouting and diagnosis used to confirm the situation.
What data is needed for crop disease prediction?
Common inputs include temperature, humidity, rainfall, leaf wetness, soil moisture, crop stage, cultivar, planting date, scouting records, previous disease history, imagery, and management actions. The exact stack depends on the crop and disease.
Are satellite images enough for crop health analysis?
Satellite images can detect stress patterns and rank fields for inspection. They usually need weather, crop-stage, scouting, and management context because water stress, nutrient problems, pests, and disease can look similar from above.
How accurate are crop health prediction models?
Accuracy depends on crop, disease, training data, weather quality, sensor placement, validation method, and local conditions. A model should report uncertainty and be tested against field observations before it guides expensive decisions.
Can small farms use predictive crop health analytics?
Yes, if the system stays focused. A small farm can begin with weather alerts, a disease forecast tool, simple scouting forms, field photos, and soil moisture checks before investing in drones, satellite subscriptions, or custom AI models.