




Last Updated June 07, 2026
An irrigation system can waste water even when every part looks modern. Timers run because it is Tuesday. Soil sensors sit in the wrong bed. Weather apps report rain that never reached the root zone. Drip lines run long enough to wet the surface, then stop before deeper roots respond. Data analytics fixes irrigation only when the data is tied to a clear water decision.
Irrigation analytics means using soil moisture, weather, evapotranspiration, rainfall, flow, pressure, crop stage, soil texture, and plant response to decide when to water, how much to apply, and whether the last irrigation reached the root zone. Irrigation analytics should produce a schedule that changes when demand, storage, and risk change.
Good irrigation data work starts with a simple loop: measure demand, check storage, apply a known amount, confirm root-zone response, and adjust the next event. That loop works for raised beds, orchards, greenhouse benches, turf zones, small farms, and field-scale irrigation. The data sources change, and the decision stays the same.
Key Takeaways
- Irrigation data analytics works when each data point answers timing, amount, runtime, or system performance.
- Soil moisture data shows root-zone storage; weather and ET data estimate crop water demand before stress appears.
- Analytics zones should follow soil texture, crop type, exposure, irrigation method, and root depth.
- Flow and pressure data catch leaks, clogged filters, broken emitters, valve failures, and uneven application.
- Automation should use guardrails such as maximum runtime, rain delay, refill limits, and manual review after alerts.
Table of Contents
Choose The Right Irrigation Analytics Setup
The right system depends on the decision you need to improve. Balcony gardeners may only need soil moisture readings and a drip timer. Vegetable growers may need ET, rainfall, soil sensors, flow records, and crop-stage thresholds. Greenhouse teams may care more about substrate moisture, light, vapor pressure deficit, and fertigation runoff than outdoor rainfall.
Pick the smallest data stack that can change a real irrigation action. Extra sensors add cost and maintenance if no one uses the readings to adjust timing, amount, or system repair.
| Site Type | Minimum Useful Data | Better Analytics Layer | Primary Decision |
|---|---|---|---|
| Home vegetable beds | Soil moisture check, rainfall, crop stage, drip runtime | Low-cost sensor, rain gauge, irrigation log | Water before shallow roots dry past the crop threshold |
| Water-efficient landscape | Hydrozone, exposure, soil texture, weekly weather | Weather-based controller, flow alert, zone audit | Separate high-water and low-water zones by actual demand |
| Orchard or vineyard | ET, soil moisture at multiple depths, crop stage, pressure | Canopy temperature, block-level yield records, salinity checks | Manage deficit, fruit quality, and deep drainage risk |
| Greenhouse crops | Substrate moisture, drain percentage, light, temperature | VPD, CO2, fertigation EC, crop load, bay-level alerts | Match irrigation pulses to plant uptake and climate load |
| Field-scale irrigation | ET, rainfall, soil water balance, flow, pressure, crop stage | Remote sensing, variable-rate zones, yield and energy cost | Apply enough water before stress without pushing water below roots |
Build The Data Stack Before Changing Schedules
An irrigation dashboard is only as good as its inputs. Each data source should have a job. Soil moisture tells you what remains in the root zone. ET estimates what the crop used. Rainfall tells you what may have entered the soil. Flow and pressure prove whether the system delivered what the schedule requested.
Garden-scale systems can connect analytics to soil moisture monitoring before adding larger automation layers. Farm and greenhouse systems usually need a stronger calibration routine because sensor errors can affect many acres or benches at once.
| Data Source | What It Answers | Common Failure | Analytics Check |
|---|---|---|---|
| Soil moisture sensor | How much water is stored where roots are active | Placed in an unrepresentative wet or dry spot | Compare with hand probe, crop response, and nearby zones |
| Weather and ET | How fast the atmosphere is pulling water from crop and soil | Weather station is too far from the site or shaded incorrectly | Compare ET trend with observed drying rate |
| Rain gauge | How much water arrived at the site | Regional rain estimate misses local storm pattern | Check sensor response after rain before canceling irrigation |
| Flow meter | Whether the zone delivered the expected volume | Slow leak or partial clog stays hidden in runtime logs | Flag flow above or below normal for the same valve |
| Pressure sensor | Whether emitters or sprinklers can apply water uniformly | Pressure looks fine at the pump and weak at the far end | Track pressure by zone during actual irrigation |
| Crop and soil records | How root depth, stage, texture, and crop sensitivity change thresholds | Same schedule is used for seedlings and mature plants | Update trigger points by crop stage and root depth |
Turn Weather, ET, And Soil Moisture Into A Water Balance
Evapotranspiration data gives irrigation analytics a demand estimate. ET rises with sun, wind, heat, and dry air. Crop coefficients adjust that weather demand for crop type, canopy size, and growth stage. Soil moisture readings then show whether the root zone still has enough stored water to meet that demand.
The crop coefficient method matters because crop evapotranspiration is calculated by multiplying reference ET by a crop coefficient. In practice, analytics turns that into a daily balance: yesterday’s stored water, plus rain and irrigation, minus crop use and losses.
| Water Balance Term | Data Needed | How It Changes Irrigation |
|---|---|---|
| Reference ET | Weather station or local ET service | Raises demand during hot, windy, sunny periods |
| Crop coefficient | Crop type, growth stage, canopy cover | Stops seedlings and mature crops from sharing one demand value |
| Soil water storage | Soil texture, root depth, field capacity, sensor readings | Shows how much depletion can occur before stress risk rises |
| Effective rainfall | Rain gauge, infiltration, runoff observation, sensor response | Credits only rain that reached the active root zone |
| Irrigation depth | Flow rate, runtime, application uniformity, wetted area | Turns runtime into inches or millimeters applied |
| Loss check | Deep sensor response, runoff, drainage, slope, pressure | Flags water moving below roots or off the zone |
Place Sensors Where They Can Correct The Schedule
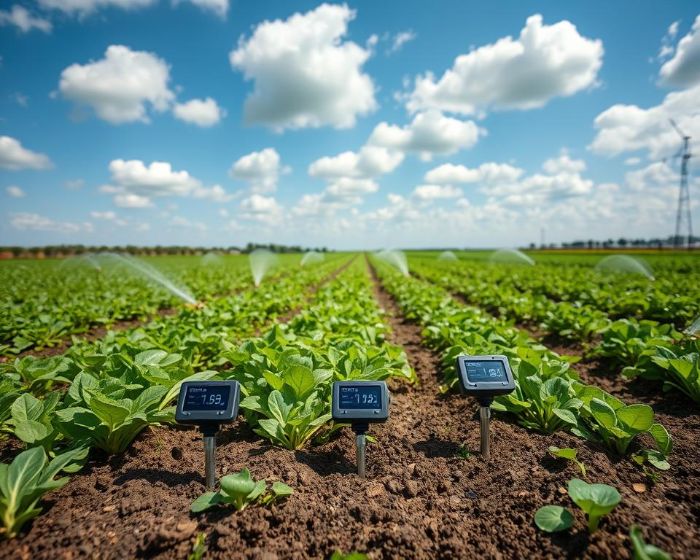
Sensor analytics fails when the sensor cannot represent the decision zone. Probes beside leaky emitters make the whole bed look wetter than it is. Dry-edge probes in a sprinkler pattern may force overwatering. Shallow sensors can warn early; deeper sensors confirm whether irrigation reached the lower root zone.
Sensor placement should follow the irrigation management zone and the decision it has to correct. For field-scale work, soil moisture sensors should be placed in representative locations and depths that match soil type, crop, and rooting depth. A home garden uses the same logic at smaller scale.
| Placement Decision | Good Analytics Practice | Bad Signal It Prevents |
|---|---|---|
| Zone selection | Separate soil texture, slope, crop, exposure, and irrigation method | A single average hides a dry high spot or wet low spot |
| Horizontal location | Place sensors in typical root areas, away from leaks and edges | One abnormal wet or dry location controls the schedule |
| Shallow depth | Track early drying, seedlings, rainfall, and short irrigation events | Water stress begins before the dashboard reacts |
| Deep depth | Confirm recharge near the bottom of active roots | Runtime stops after surface wetting or continues into deep drainage |
| Multiple stations | Use more than one station where soil and application uniformity vary | One bad probe drives a field, orchard block, or long drip zone |
The physical irrigation system still controls whether analytics can act. If the layout forces unrelated plants onto one valve, the data will expose the problem without fixing it. A water-efficient garden layout gives the analytics system cleaner zones to manage.
Convert Readings Into Timing, Amount, And Runtime
A useful irrigation analysis ends in a number the system can use. That might be an irrigation trigger, a refill depth, a runtime, a pulse count, or an alert. The method can stay simple when it connects units.
Drip systems need flow and runtime converted into a known application amount. Sprinkler zones need catch-can results or audited precipitation rate. Containers and greenhouse benches depend more on substrate moisture, drain percentage, and pulse response. Drip irrigation setup should come before advanced analytics because clogged lines, long laterals, and pressure loss can make the data look like a crop problem.
| Analytics Output | How To Calculate Or Set It | Decision It Controls |
|---|---|---|
| Irrigation trigger | Set a soil moisture or depletion threshold by crop sensitivity and soil texture | When watering starts |
| Refill target | Raise moisture back into the desired range without filling beyond field capacity | How much water to apply |
| Runtime | Divide required volume or depth by measured flow or precipitation rate | How long the valve runs |
| Pulse spacing | Split runtime when infiltration is slower than application | How quickly water enters the soil without runoff |
| Rain delay | Confirm rainfall with local gauge and sensor response | Whether scheduled irrigation is skipped or reduced |
| Season adjustment | Update thresholds and runtime after canopy growth, harvest, pruning, or weather shift | How the schedule changes across the season |
Even a smart controller needs ground truth. Mixed landscapes should still use efficient watering strategies such as root-depth checks, runoff checks, and seasonal runtime reviews after schedule changes.
Find Waste With Flow, Pressure, And Runoff Signals
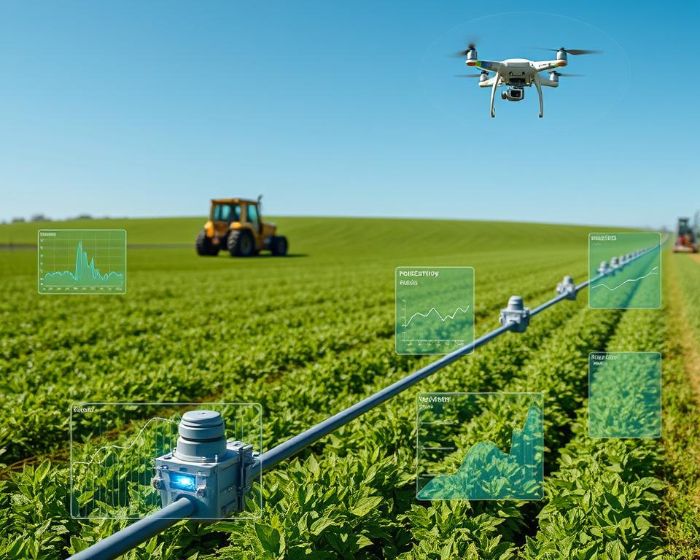
Soil moisture tells only part of the irrigation story. A zone can have good soil moisture and still waste water through a leak, broken sprinkler, poor pressure, surface runoff, or deep percolation. Analytics should compare what the controller requested with what the system actually delivered.
| Signal | Likely Problem | Analytics Response | Field Check |
|---|---|---|---|
| High flow during normal runtime | Broken line, stuck valve, missing emitter, cracked fitting | Stop zone and send leak alert | Inspect wet spots, valve box, main line, and far end |
| Low flow with normal pressure | Clogged filter, blocked emitter, closed valve, weak pump intake | Flag maintenance before extending runtime | Flush line and compare emitter output |
| Pressure drop during irrigation | Demand exceeds supply or pipe size is limiting the zone | Split zone, shorten laterals, or stagger valves | Measure pressure at head and far end |
| Shallow sensor rises, deep sensor does not | Runtime too short or infiltration blocked near surface | Add pulse cycles or increase refill amount within limits | Probe moisture at root depth after irrigation |
| Deep sensor rises above target after each event | Over-irrigation or refill target too high | Reduce runtime, improve trigger, or adjust soil capacity estimate | Check drainage, leaching risk, and crop response |
| Sensor stays flat after irrigation | Bad sensor, dead battery, dry pocket, or water missing that location | Hold automation changes until the signal is verified | Hand probe and inspect wiring, battery, and emitter pattern |
Analytics should judge repeated mismatches between runtime, flow, pressure, and root-zone response before the schedule is tuned again. A one-day anomaly may be a storm, broken wire, or temporary valve issue. Repeated mismatches deserve repair first.
Use Forecasts And Automation With Guardrails
Forecasts help irrigation systems act before stress appears. A hot, windy forecast can move an irrigation event earlier. A likely rain event can reduce planned runtime if the root zone has enough reserve. Automation becomes risky when forecast data overrides local evidence for too long.
Soil-moisture and weather-based irrigation scheduling becomes more useful when sensor readings, forecast demand, and local root-zone response are reviewed together before automation changes the next irrigation event.
Use automation for routine adjustment and alerts, then keep a review layer for unusual weather, new plantings, harvest periods, sensor replacement, and system repairs. Greenhouse systems need an even tighter loop because irrigation demand can change quickly with light, temperature, humidity, and CO2. Climate-aware irrigation decisions can connect with IoT greenhouse climate control when substrate moisture and microclimate data share one operating view.
| Automation Rule | Why It Helps | Guardrail |
|---|---|---|
| Skip after measured rain | Prevents watering after a useful storm | Confirm root-zone response before skipping sensitive crops |
| Increase runtime during high ET | Matches demand during heat, wind, and low humidity | Cap refill so water does not move below roots |
| Split irrigation into pulses | Improves infiltration on slopes, clay, crusted soil, and containers | Check total applied depth after all pulses finish |
| Flow alert stops a zone | Limits water loss from leaks and breaks | Require visual repair check before restarting automation |
| Seasonal model update | Reflects canopy growth, pruning, harvest, or crop stage | Compare with plant response and sensor trend before locking changes |
Review Water Savings, Crop Response, And Model Drift
Analytics should be judged by water saved, crop response, runoff reduction, leaching control, pumping cost, and earlier maintenance detection. A better irrigation system uses less unnecessary water, protects crop performance, reduces runoff and leaching, lowers pumping cost, and makes maintenance issues visible sooner.
The review should compare the current season with a baseline. Use water applied per zone, irrigation frequency, plant stress observations, yield, quality, energy use, and repair records. If yield forecasting is part of the operation, machine learning yield forecasting can help connect water decisions with expected harvest risk.
| Review Metric | What To Compare | What A Good Result Looks Like |
|---|---|---|
| Water applied | Gallons, acre-inches, or liters per zone against prior seasons | Lower waste without new stress symptoms |
| Root-zone response | Sensor response after irrigation and rainfall | Moisture rises through the active root zone and stays within target range |
| Uniformity | Catch-can test, emitter output, pressure, crop pattern | Dry and wet spots shrink after maintenance |
| Plant performance | Wilt, canopy growth, fruit set, quality, yield, recovery after heat | Crop health and harvest quality stay within target range |
| Maintenance signals | Leaks, clogs, pressure alarms, stuck valves, filter events | Problems are found earlier and repaired with less water loss |
| Model drift | Predicted depletion against actual sensor trend | Thresholds are recalibrated after soil, crop, sensor, or weather changes |
A season-end review should ask what the data changed. If the schedule, runtime, repair timing, or crop response did not improve, simplify the system until the dashboard produces clearer decisions.
Conclusion
Irrigation data analytics improves watering when it connects measurements to action. Soil moisture shows storage. ET estimates demand. Flow and pressure prove delivery. Crop stage and soil texture set the threshold. The schedule becomes smarter only after those signals change timing, amount, runtime, or maintenance.
A useful irrigation system applies a known amount of water at the right time, confirms that roots received it, catches waste quickly, and learns from each season.
FAQ
What data is most useful for improving irrigation?
Soil moisture, rainfall, ET, flow, pressure, crop stage, soil texture, and root depth usually matter most. Start with the data that can change when you irrigate, how much you apply, or whether a zone needs repair.
Can irrigation analytics work without expensive sensors?
Yes. A rain gauge, irrigation log, soil probe, local ET data, and measured runtime can improve decisions. Sensors become more valuable when the site has multiple zones, high crop value, or frequent weather swings.
How often should irrigation data be reviewed?
Review soil moisture and weather during active growth at least weekly, and more often during heat, establishment, flowering, fruiting, or greenhouse production. Flow and pressure alerts should be checked as soon as they appear.
What is the difference between soil moisture scheduling and ET scheduling?
Soil moisture scheduling measures water stored in the root zone. ET scheduling estimates crop water use from weather and crop stage. Reliable irrigation decisions use ET to predict demand and soil moisture to confirm storage.
Should irrigation be fully automated?
Full automation is safest when the system has calibrated sensors, flow checks, pressure checks, rain confirmation, and clear override rules. New plantings, repairs, sensor changes, and unusual weather still need human review.
How do you know irrigation analytics is saving water?
Compare water applied, root-zone moisture, plant stress, yield or plant quality, runoff, and repair alerts against a baseline season. Water savings count only when crop health and usable output stay within the target range.