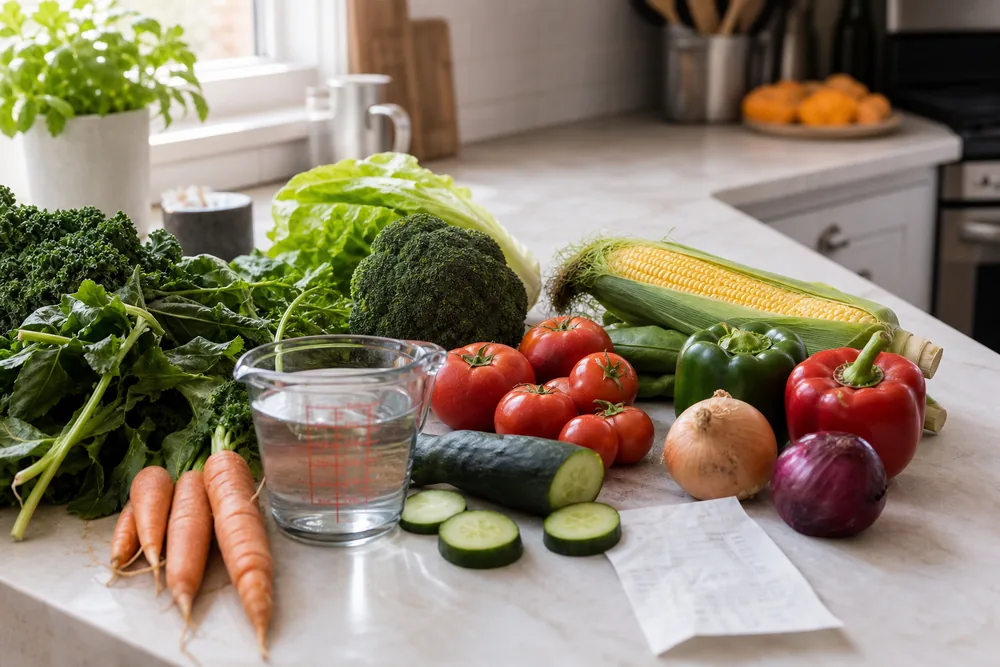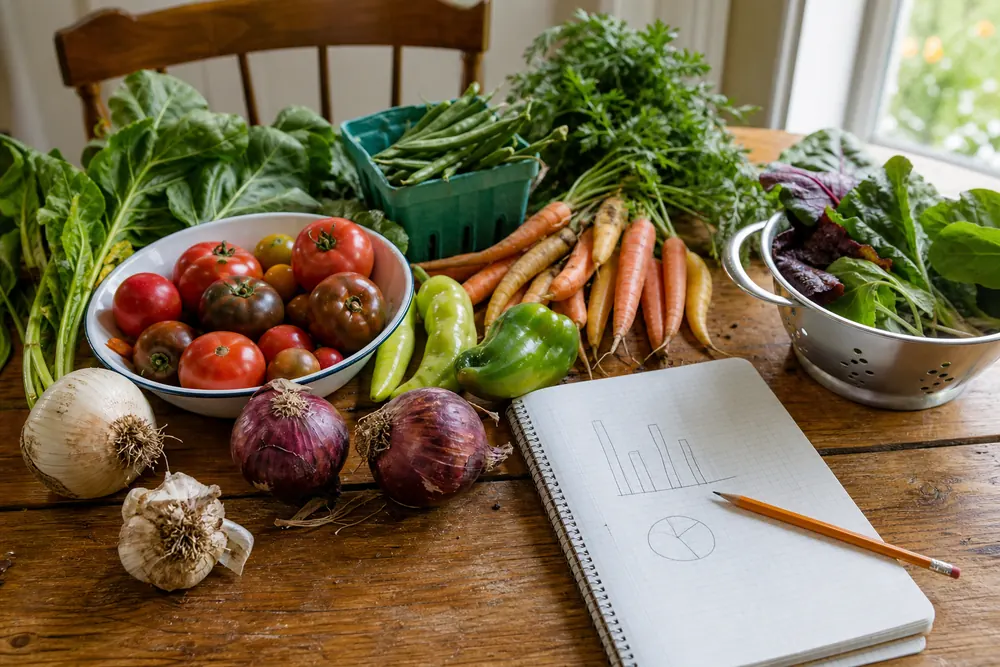
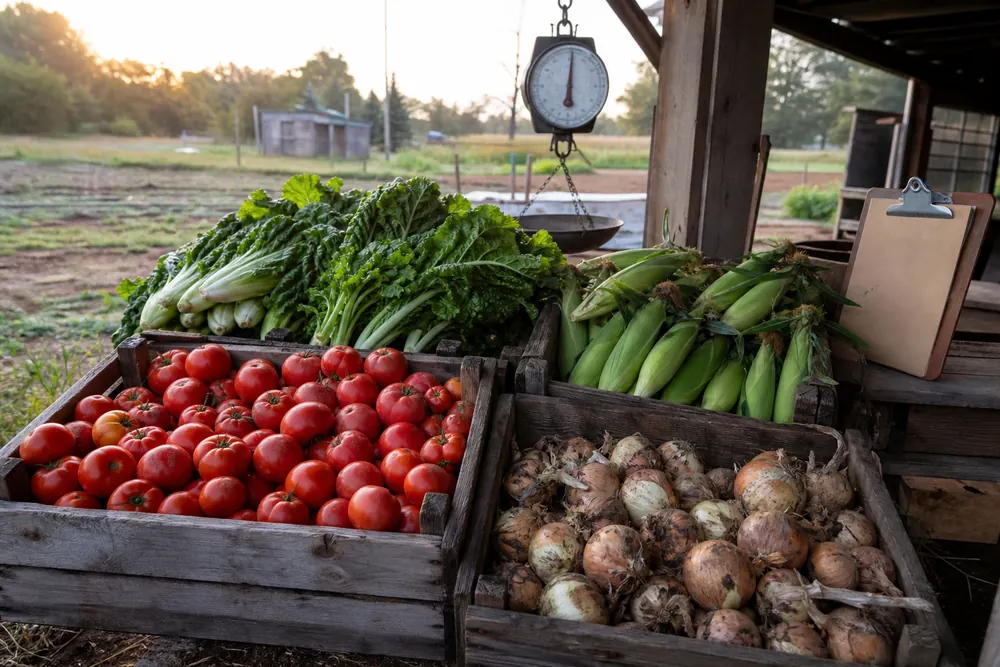
Vegetable statistics show a split food system: U.S. farms can move hundreds of millions of hundredweight through fields and packing lines, and only one in ten adults meets vegetable intake recommendations. The gap is visible in ordinary places – cured onions rattling in a bin, sweet corn headed for a freezer line, lettuce wilting in a refrigerator drawer, and a grocery receipt that makes a cook choose between fresh, frozen, and canned.
The clearest 2026 picture comes from several data streams, not one neat scoreboard. USDA production reports show which crops carry the most acreage and tonnage. CDC intake data shows how far adults remain from daily vegetable targets. Price datasets show why cost depends on edible cup equivalents, processing form, and timing. For gardeners, those numbers make the backyard feel less small. A raised bed cannot replace the national supply chain, and it can change the few vegetables a household eats most often.
Key Takeaways
- Track production through crop volume, acreage, and value together.
- Compare prices by edible cup, not package weight.
- Notice the intake gap before judging demand.
- Avoid treating fresh, frozen, and canned data as identical.
- Recheck USDA updates when 2025 crop summaries publish.
Table of Contents
Vegetable Statistics Baseline – The Numbers That Set The Scale
Vegetable data looks simple until the measurement changes. Production is reported in hundredweight, tons, acres, value, or utilization. Consumption may mean availability, retail purchase, or actual intake after waste. Prices can be shown per pound, per package, or per edible cup. Sweet corn for processing, lettuce for fresh cartons, onions for storage, and carrots sold both fresh and processed all answer different questions.
A hundredweight, often written as cwt, equals 100 pounds. That one unit explains why commercial numbers can feel oversized beside a backyard bed. The USDA NASS 2024 annual vegetable summary reports tomatoes at 236 million cwt, onions at 77.1 million cwt, and sweet corn at 52.7 million cwt. Those are not dinner-table numbers. They are harvest, storage, trucking, processing, labor, water, and market timing compressed into one line.
| Statistic | Latest Figure | What It Means |
|---|---|---|
| Adults meeting vegetable recommendations | 10.0% | The intake gap remains much larger than the supply conversation suggests. |
| Largest production crop | Tomatoes at 236 million cwt in 2024 | Processing demand can push one crop far above fresh-only crops. |
| Highest reported crop value | Onions at $2.00 billion in 2024 | Crop value can rank differently than crop volume. |
| ERS fruit and vegetable price coverage | 150+ products | Fresh and processed forms can be compared by edible cup equivalent. |
| Daily vegetable recommendation | 2-3 cup equivalents for many adults | Age, sex, and activity level change the target. |
One useful reading question is this: does the number describe food grown, food available, food bought, or food actually eaten? Mixing those four layers leads to bad conclusions. A crop can be widely produced and still under-consumed. Price can look cheap per pound and costly per edible cup after trimming. Good intentions can put greens in the cart and still lose half the bag to slime before dinner.
U.S. Vegetable Production Statistics – Volume And Value Do Not Rank The Same
The 2024 production table works better as a map of crop form and market use. Tomatoes sit at the top by volume because processing pulls in huge tonnage for paste, sauce, canned tomatoes, salsa, soup, and institutional food. Onions rank slightly higher by reported crop value. Lettuce stays almost entirely fresh. Sweet corn, cucumbers, snap beans, carrots, cabbage, spinach, and peppers split into different fresh and processing paths.
The USDA NASS annual summary reports tomatoes at 236 million cwt, onions at 77.1 million cwt, sweet corn at 52.7 million cwt, head lettuce at 41.8 million cwt, romaine lettuce at 39.1 million cwt, carrots at 24.8 million cwt, cabbage at 20.7 million cwt, broccoli at 13.5 million cwt, cucumbers at 11.3 million cwt, snap beans at 10.7 million cwt, bell peppers at 9.81 million cwt, and spinach at 6.17 million cwt. That spread matters more than the top crop. It shows which vegetables are built for storage, fresh shipping, processing, fast turnover, or repeated picking.
Onions tell the first counterweight story. Production reached 77.1 million cwt in 2024, up 5% from the year before, and the reported value reached $2.00 billion. Carrots were lower in volume at 24.8 million cwt, with reported value reaching $1.72 billion. Broccoli reached 13.5 million cwt and $1.09 billion in value. Head lettuce, romaine, and leaf lettuce together show how much of the vegetable market depends on speed, cold chains, and freshness with little storage margin.
| Crop | 2024 Production | Year Change | Reported Value |
|---|---|---|---|
| Onions | 77.1 million cwt | Up 5% | $2.00 billion |
| Tomatoes | 236 million cwt | Down 14% | $1.97 billion |
| Carrots | 24.8 million cwt | Down 14% | $1.72 billion |
| Sweet corn | 52.7 million cwt | Down 14% | $895 million |
| Head lettuce | 41.8 million cwt | Down 4% | $1.67 billion |
| Romaine lettuce | 39.1 million cwt | Down 6% | $1.66 billion |
| Cabbage | 20.7 million cwt | Down slightly | $642 million |
| Broccoli | 13.5 million cwt | Down 3% | $1.09 billion |
| Cucumbers | 11.3 million cwt | Down 21% | $226 million |
| Snap beans | 10.7 million cwt | Down 21% | $324 million |
| Bell peppers | 9.81 million cwt | Down 8% | $626 million |
| Spinach | 6.17 million cwt | Down 27% | $545 million |
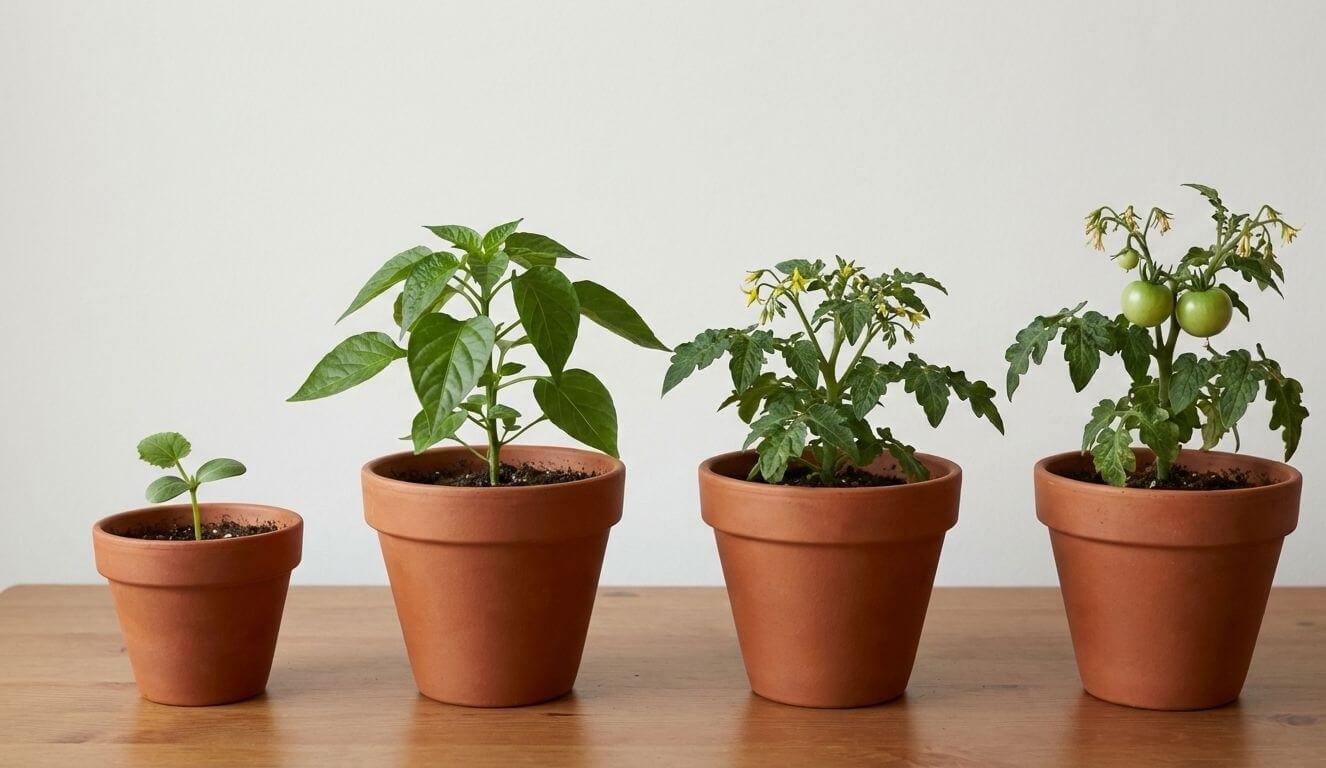
The production lesson for gardeners is crop purpose. Tomatoes can become sauce, salsa, paste, and freezer bags, and tomato growth stages help explain why harvest timing changes quality so quickly. Onions can cure and store. Carrots can hold in the refrigerator or cellar. Lettuce gives speed and freshness with little storage margin. Beans and peppers reward repeated picking. A backyard plan that treats all vegetables as the same kind of harvest usually produces a crowded counter and a tired cook.
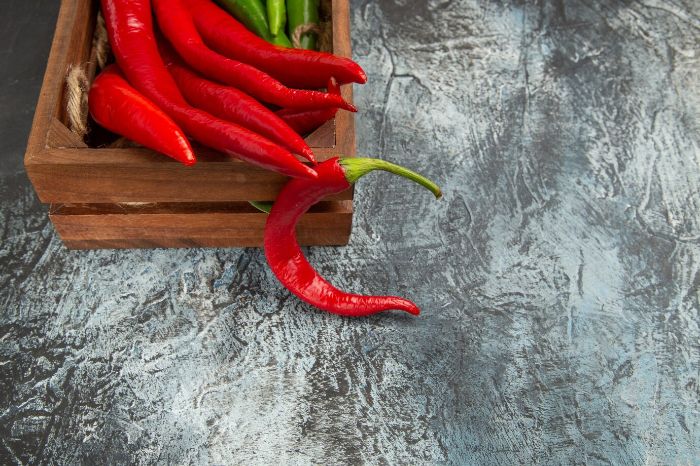
Pro Tip: If a vegetable appears in your kitchen in three forms – fresh, cooked, and stored – give it the best space first. Tomatoes, peppers, onions, carrots, herbs, and beans often return more real meals than a bed full of delicate crops that need picking, washing, and eating on the same day.
Vegetable Consumption Statistics – The Intake Gap Is Still The Main Story
The harshest vegetable number comes from intake. In the CDC analysis of 2019 adult behavior, only 10.0% of U.S. adults met vegetable intake recommendations, and 12.3% met fruit recommendations. The same CDC adult intake surveillance report found vegetable recommendation rates as low as 5.6% in Kentucky and as high as 16.0% in Vermont.
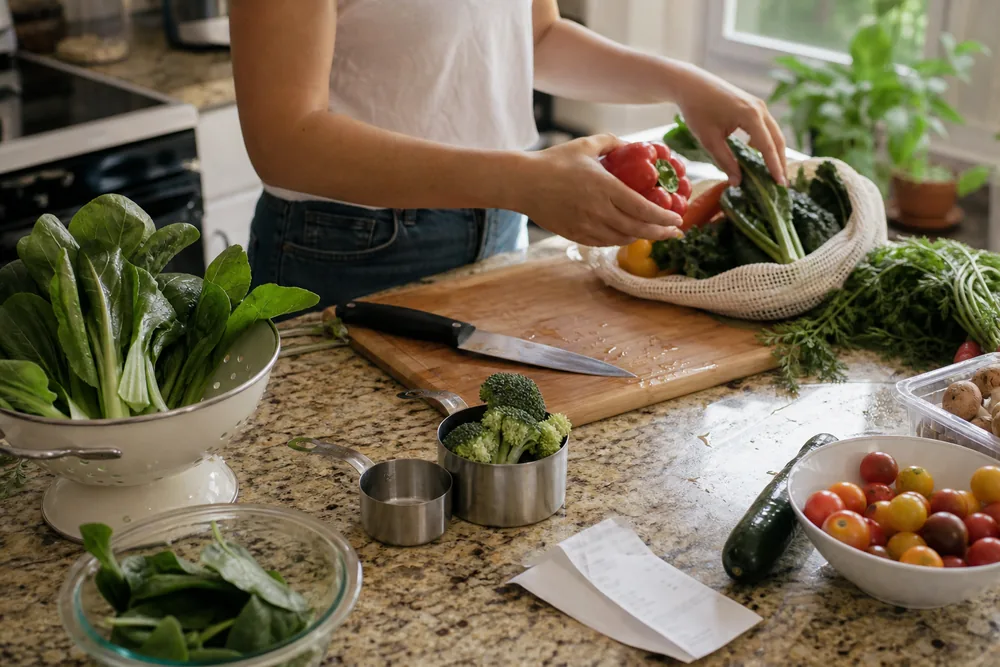
Daily vegetable targets commonly fall around 2-3 cup equivalents for adults, with the exact amount changing by age, sex, and activity level. That makes the one-in-ten result feel less like a personal failure and more like a food routine problem. Vegetables take washing, cutting, cooking, seasoning, storage, and repeat access. A crisp carrot or pepper is easy to admire. It is less easy to turn into a habit after work, with a tired knife hand and a pan already in the sink.
The CDC also found lower vegetable recommendation rates among adults with lower income. That detail changes the tone of the conversation. Intake is not only a preference score. It touches price, time, transportation, kitchen equipment, neighborhood retail, childhood habits, and the fact that many vegetables spoil faster than the packaged foods competing for the same dollar.
Observation: People tend to grow more vegetables after they stop trying to grow everything. A small, repeated harvest of salad greens, cherry tomatoes, or herbs changes meals because it fits the week. A dozen unfamiliar crops can become another chore.
Garden content can help when it moves from inspiration to friction. A reader deciding between container vegetables by size, light, and space needs a shorter path to dinner, not a longer plant list. Leafy greens, bush beans, herbs, cherry tomatoes, and peppers fit many small spaces because they can be harvested in amounts that match a meal.
Vegetable Price Statistics – Cost Changes When Edible Cups Replace Pounds
Vegetable prices are easy to misread when package weight becomes the only comparison. A pound of winter squash, a pound of spinach, and a pound of canned tomatoes do not deliver the same edible amount, preparation time, storage life, or waste. The USDA ERS price dataset handles that problem by estimating average prices for more than 150 fresh and processed fruits and vegetables, including cost per edible cup equivalent.
The USDA ERS fruit and vegetable price data currently includes 2013, 2016, 2020, 2022, and 2023 retail scanner releases. ERS cautions against using that dataset as a year-to-year inflation tracker because collection methods and product coverage are built for average price comparisons, not monthly price movement.
For inflation, the USDA ERS Food Price Outlook tracks Consumer Price Index and Producer Price Index changes and forecasts food price movement up to 18 months ahead. That source is better for price direction; the fruit and vegetable price tables are better for comparing forms. A frozen vegetable can look more expensive per package and still cost less per edible cup once trimming, spoilage, and cooking yield enter the math.
The home garden version has the same trap. A tomato plant with cages, soil mix, fertilizer, irrigation parts, and time may not beat the cheapest grocery tomato on price. Lettuce can be cheap in season and costly after a heat wave. Peppers, herbs, specialty beans, and baby greens may return more value because store prices rise when quality, freshness, or small package size matters. The honest tradeoff is that a garden saves money only when setup costs stay controlled and harvests match what the household eats.
Vegetable Supply Data – Availability Is Not The Same As Eating
Supply data answers a different question from intake data. The USDA ERS vegetables and pulses yearbook tables track annual supply, availability, prices, imports, exports, and related measures across long time series. These tables are useful for seeing how fresh, canned, frozen, dehydrated, and pulse categories move through the food system.
Food availability is a proxy, not a plate count. The USDA food availability data system describes available food after production, imports, exports, stock changes, and nonfood uses are considered. Loss-adjusted datasets then estimate what remains after retail, foodservice, and consumer-level losses. For vegetables, that distinction matters because trim, spoilage, plate waste, and processing losses can be high.
| Question | Best Data Lens | What To Watch |
|---|---|---|
| Which vegetables dominate U.S. production? | NASS annual vegetable summary | Separate fresh market from processing where possible. |
| Are adults eating enough vegetables? | CDC intake surveillance | Use recommendation rates, not supply volume. |
| Which form costs less to serve? | ERS price per edible cup | Compare fresh, frozen, canned, and dried forms. |
| How much food is available nationally? | ERS food availability | Availability is not the same as actual intake. |
| How should a gardener choose crops? | Kitchen use plus growing conditions | Match light, space, storage, and weekly meals. |
Imports and processing also shift the meaning of a vegetable statistic. A fresh cucumber in January, a can of tomatoes in March, and a freezer bag of sweet corn in December all depend on different supply paths. The shopper sees one produce choice. The data sees season, origin, processing, storage, transport, and loss.
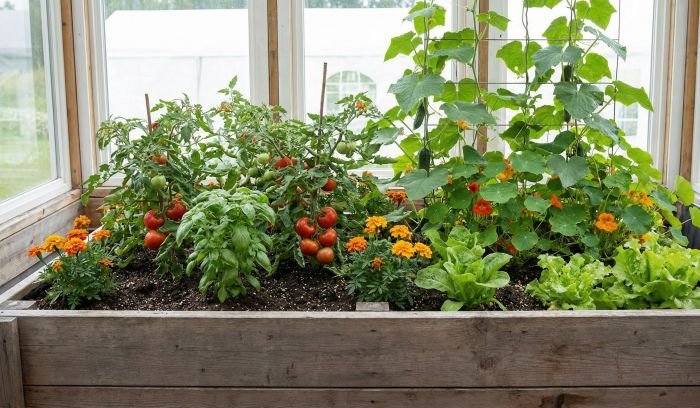
Home Garden Vegetable Statistics – Small Plots Matter When They Change Routine
Home gardens rarely show up with the force of commercial production tables, and they can change the household layer that national data struggles to reach. The useful garden statistic is not always pounds harvested. Sometimes it is how many nights a week vegetables make it onto the plate because they are already outside the door.
A container of basil does not move national intake numbers by itself. It can make tomatoes, beans, eggs, pasta, and leftovers taste more finished. A short row of lettuce does not compete with Salinas Valley acreage. It can put greens into lunches for three weeks before summer heat turns the leaves bitter. For limited space, container depth by vegetable root type matters because carrots, tomatoes, greens, and herbs do not use soil volume the same way.
The best crop choices come from overlap. Pick vegetables that your household already buys, that suit your light, and that tolerate your attention pattern. Tomatoes need support and a longer season. Bush beans need repeated picking. Lettuce and spinach need cool timing. Onions need patience and curing space. Carrots need loose soil. Peppers need heat. The national tables show scale; vegetable growth stages tell you which part of that scale can become dinner without waste.
Failure has a pattern here. Gardeners often overplant the exciting crop and underplant the reliable crop. Six zucchini plants can bury a kitchen. Two healthy pepper plants may be just right. A smaller harvest that gets eaten has more value than a heavy harvest that softens on the counter.
Where To Start
When your grocery bill feels high and your schedule is tight, start with herbs, greens, and one fruiting crop you already buy. Put them near the kitchen or the door you use most, then harvest twice a week before leaves yellow or fruit overripens.
With strong sun and limited bed space, choose crops with repeated harvests. Cherry tomatoes, peppers, bush beans, and cut-and-come-again greens give more meals from the same square footage than a one-time novelty crop.
For a refrigerator that wastes vegetables, grow smaller amounts more often. A weekly handful of herbs, a bowl of lettuce, or a pint of tomatoes can work better than one heavy harvest that needs washing, chopping, and storing all at once.
For data-based planning, separate production, price, and intake before making a claim. Then check whether the number describes crop volume, edible cup cost, food availability, or actual adult behavior.
Conclusion
Vegetable statistics for 2026 point to a simple tension: the United States can produce huge vegetable volumes, and most adults still fall short of recommended intake. Production data reads as supply. CDC intake data reads as behavior. Price data needs its unit checked first: pound, package, or edible cup.
For gardeners, the starter priority is narrow and practical: grow the vegetables your household already eats, in amounts you can harvest and use within the week. Success looks less like a record-breaking basket and more like a cutting board with crisp greens, warm tomatoes, onion skins flaking dry, and no forgotten produce turning soft in the drawer.