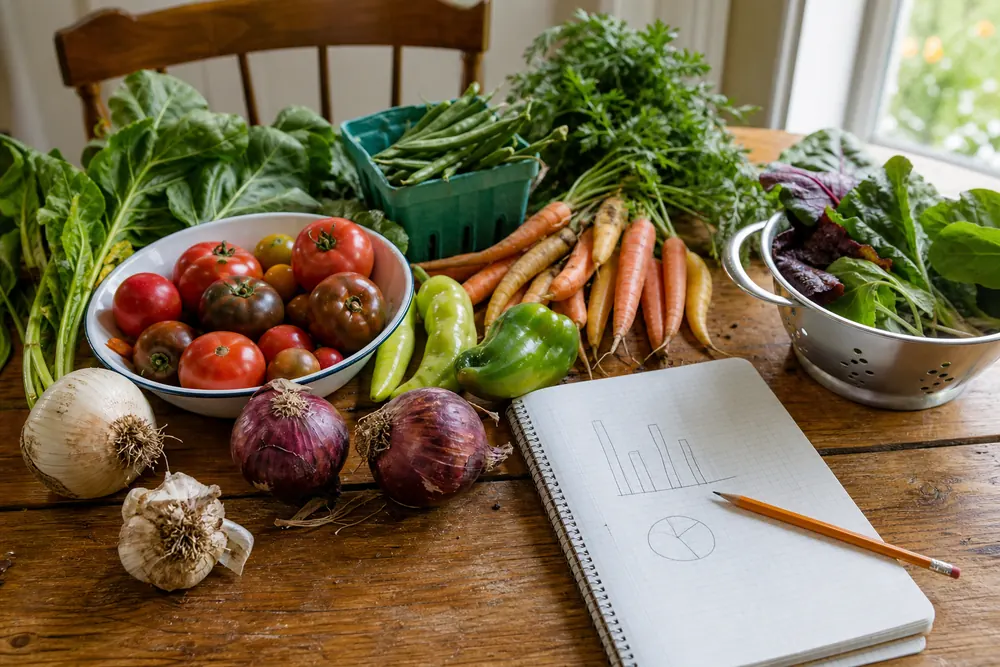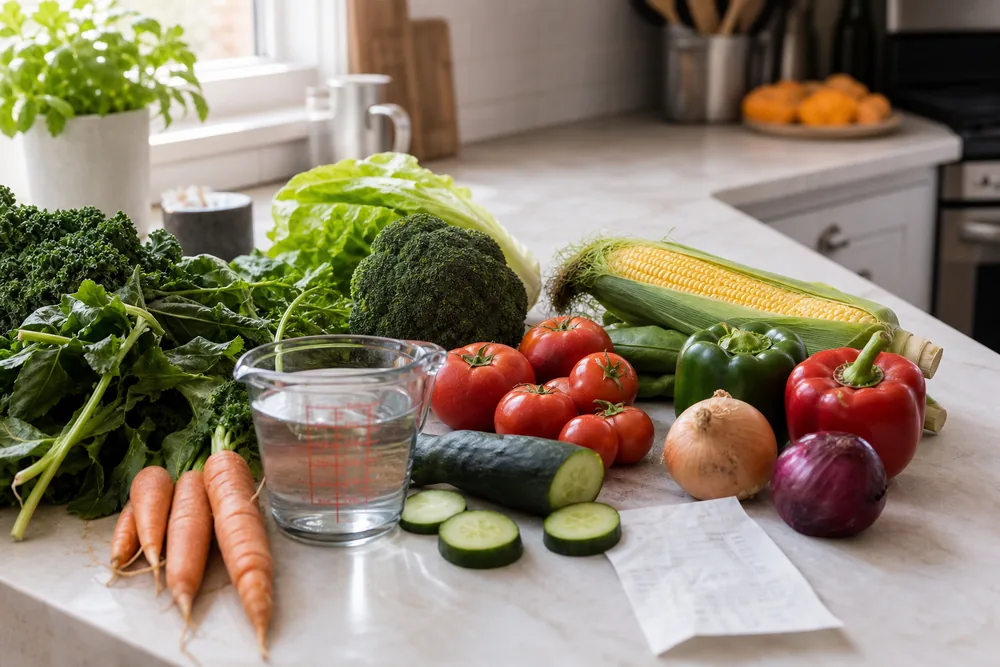
Vegetable consumption statistics show a wide U.S. gap: only 10.0% of adults met vegetable intake recommendations in the latest CDC state analysis, and USDA data still showed 373.8 pounds of vegetables available per person in 2022. The mismatch is easy to picture on a weeknight counter – washed greens ready for lunch, carrots still in the bag, canned tomatoes waiting for sauce, and a refrigerator drawer that can turn good intentions soft by Friday.
Two kinds of numbers matter. Intake surveys estimate whether people actually meet recommendations. Food availability estimates how much vegetable supply moves through the system before every household loss, plate scrap, and forgotten bag of spinach. A strong vegetable statistic names which one it uses, because a supply number does not prove that dinner changed.
Key Takeaways
- Quote intake and availability as different measurements.
- Use 10.0% as the adult benchmark.
- Track child data by age, state, and food access.
- Separate fresh-market crops from processing-heavy crops.
- Check CDC and USDA releases before annual updates.
Table of Contents
Vegetable Consumption Data Explorer
Switch between the main statistical views: adult intake, child intake, supply trend, and crop mix.
Sources: CDC BRFSS 2019 adult fruit and vegetable intake analysis, CDC NSCH 2021 young child food and beverage analysis, USDA ERS food availability and vegetables yearbook tables.
Vegetable Consumption Statistics Snapshot – Intake And Supply Benchmarks
The main numbers split into intake, frequency, and supply measurements. The CDC 2019 BRFSS intake analysis measured adults meeting recommendations from survey responses. The CDC 2021 National Survey of Children’s Health analysis measured whether young children ate vegetables daily during the preceding week. USDA ERS measured supply through the food availability data system.
| Statistic | Population Or Measure | Year | Figure | Plain-English Read |
|---|---|---|---|---|
| Adults meeting vegetable recommendations | U.S. adults | 2019 | 10.0% | About one in ten adults met the vegetable target. |
| Adult sample size | CDC BRFSS respondents after exclusions | 2019 | 294,566 adults | The adult benchmark comes from a large state-based survey. |
| Adult state range | Adults meeting recommendations | 2019 | 5.6% to 16.0% | The highest state rate was less than one in six adults. |
| Children missing daily vegetables | Children ages 1-5 | 2021 | 49.1% | Nearly half did not eat a vegetable every day during the preceding week. |
| Child sample size | CDC NSCH respondents | 2021 | 18,386 children | The child estimate covers ages 1-5. |
| Child state range | Children ages 1-5 missing daily vegetables | 2021 | 30.4% to 64.3% | The state gap ran from Vermont to Louisiana. |
| States above half | Children ages 1-5 missing daily vegetables | 2021 | 20 states | More than half of young children missed daily vegetables in 20 states. |
| Total vegetable availability | Fresh-weight-equivalent supply per person | 2022 | 373.8 lb | This is supply availability, not actual eaten volume. |
| Total availability change from 2000 | Fresh-weight-equivalent supply per person | 2000-2022 | -51.4 lb, -12.1% | Per-person availability was lower than its 2000 level. |
| Selected fresh vegetables | Fresh availability per person | 2024 | 147.6 lb | Fresh selected vegetables were near the 2000 level. |
| Selected processing vegetables | Processing availability per person | 2024 | 95.2 lb | Processing availability was well below 2000. |
| Potatoes plus tomatoes | Share of 2022 total availability | 2022 | 49.8% | Two crop groups carried nearly half of vegetable availability. |
The most common mistake is treating every row as the same kind of consumption. Adult and child rows are survey-based intake or frequency estimates. USDA rows are availability estimates. Both belong in the same discussion. They should not be averaged together or used as if pounds of supply equal cups eaten.
Adult Vegetable Intake Statistics – One In Ten Is The Benchmark
Adult vegetable intake is low across almost every cut of the CDC data. Respondents were asked about salads, fried potatoes, other potatoes, and other vegetables during the past 30 days. The method is behavior-based, which makes the 10.0% benchmark more useful for public health comparisons than a grocery-supply figure.
Federal guidance cited by CDC points many adults toward 2-3 cup-equivalents of vegetables per day, depending on age, sex, and activity level. The adult estimate says that nine out of ten adults fell short of that level in the state analysis. Higher-income and older-adult groups did better, and no adult group in the national demographic table came close to a majority.
| Adult Group | Meeting Vegetable Recommendations | Difference From All Adults | What It Shows |
|---|---|---|---|
| All adults | 10.0% | Baseline | The national benchmark sits near one in ten. |
| Men | 7.6% | -2.4 percentage points | Men were below the all-adult estimate. |
| Women | 12.4% | +2.4 percentage points | The estimate was higher and still far from a majority. |
| 18-30 year olds | 7.1% | -2.9 percentage points | Younger adults had the lowest age-group estimate. |
| 31-50 year olds | 8.7% | -1.3 percentage points | Midlife adults remained below the benchmark. |
| 51+ year olds | 12.5% | +2.5 percentage points | Older adults had the highest age-group estimate. |
| Black adults | 6.9% | -3.1 percentage points | The estimate was below the white and Hispanic estimates in the table. |
| Hispanic adults | 11.0% | +1.0 percentage points | The estimate was slightly above the all-adult benchmark. |
| White adults | 10.1% | +0.1 percentage points | The estimate closely matched the all-adult benchmark. |
| Lowest income group | 6.8% | -3.2 percentage points | Income showed one of the clearest gaps. |
| Middle income group | 7.7% | -2.3 percentage points | The middle group still sat below one in ten. |
| Highest income group | 12.2% | +2.2 percentage points | The rate was about 1.8 times the lowest-income estimate. |
The income line changes how the statistic should be read. A missed vegetable target is often treated as a preference problem. Price, transportation, storage, time, and the food environment sit behind the CDC income gap. A bag of salad can be easy to buy and still hard to use if a household lacks predictable cold storage, a workable kitchen routine, or money for repeat purchases.
| Rank | Lowest States | Adults Meeting Recommendations | Highest States | Adults Meeting Recommendations |
|---|---|---|---|---|
| 1 | Kentucky | 5.6% | Vermont | 16.0% |
| 2 | Alabama | 6.7% | New York | 14.2% |
| 3 | West Virginia | 6.9% | Connecticut | 14.1% |
| 4 | Oklahoma | 6.9% | Rhode Island | 13.4% |
| 5 | Michigan | 7.2% | Arizona | 12.8% |
| 6 | North Dakota | 7.3% | District of Columbia | 12.8% |
| 7 | Louisiana | 7.3% | New Hampshire | 12.3% |
| 8 | Iowa | 7.3% | Oregon | 12.2% |
Child Vegetable Consumption Statistics – Daily Exposure Starts Uneven
Child data shows a frequency problem. In the CDC child analysis, 49.1% of children ages 1-5 did not eat a vegetable daily during the preceding week in 2021. Fruit and beverage numbers sharpen the picture: 32.1% did not eat a daily fruit, and 57.1% drank a sugar-sweetened beverage at least once during the preceding week.
The child measure is frequency, not serving size. A child who ate one bite of broccoli and a child who ate a full serving could both count as having daily vegetable exposure. That limit matters, and the measure still captures whether vegetables appear often enough to become normal at the table.
| Group | Did Not Eat Daily Vegetables | Drank Sugar-Sweetened Beverage Weekly | Meaning |
|---|---|---|---|
| All children ages 1-5 | 49.1% | 57.1% | Nearly half missed daily vegetables during the preceding week. |
| 1-year-olds | 43.9% | 30.9% | Vegetable gaps started before preschool. |
| 2-year-olds | 47.7% | 51.4% | Daily vegetables fell below half by age two. |
| 3-year-olds | 49.7% | 61.4% | The vegetable gap reached about half of children. |
| 4-year-olds | 50.5% | 67.8% | More than half missed daily vegetables. |
| 5-year-olds | 53.2% | 72.3% | This age had the highest missed-daily-vegetable estimate. |
| Always could afford nutritious meals | 46.5% | 53.1% | Food security helped, with a large gap remaining. |
| Could afford enough, not always nutritious food | 56.2% | 69.2% | Marginal food sufficiency raised the missed-vegetable rate. |
| Sometimes or often could not afford enough food | 59.0% | 70.9% | Low food sufficiency carried the highest vegetable gap. |
Texture and smell matter with children. A raw pepper strip snaps cleanly, steamed broccoli can smell sulfurous, and cooked carrots can turn soft at the edge. Repeated exposure works better when the vegetable arrives in a form the child can handle more than once, away from one-time nutrition performances.
| Rank | Lowest States | Children Missing Daily Vegetables | Highest States | Children Missing Daily Vegetables |
|---|---|---|---|---|
| 1 | Vermont | 30.4% | Louisiana | 64.3% |
| 2 | Maine | 33.9% | Oklahoma | 57.5% |
| 3 | Washington | 35.5% | Alabama | 57.3% |
| 4 | New Hampshire | 38.5% | New Jersey | 57.1% |
| 5 | Minnesota | 41.2% | Rhode Island | 56.2% |
| 6 | Tennessee | 42.5% | Mississippi | 55.8% |
| 7 | Montana | 42.8% | New York | 55.6% |
| 8 | Oregon | 43.2% | Hawaii | 55.5% |
State rankings should be quoted with the direction clear. For adults, a higher percentage means more people met recommendations. For children in the NSCH table, a higher percentage means more children missed daily vegetables. The direction flips, and that flip is where many bad summaries go wrong.
Per-Capita Vegetable Availability – The Long-Term Line Is Not Straight
USDA ERS availability data often gets described as consumption data. A plate count would measure something narrower. This number estimates food available after production, imports, exports, stock changes, and nonfood uses. It does not subtract every household-level loss, and it does not prove that one person ate 373.8 pounds of vegetables in 2022.
The long-term line is still useful. The USDA ERS fresh-weight-equivalent series put total vegetable availability at 336.3 pounds per person in 1970, 425.2 pounds in 2000, and 373.8 pounds in 2022. That makes the latest figure higher than 1970 and lower than 2000, 2010, and 2019.
| Year | Availability Per Person | Change Versus 2022 | What The Comparison Shows |
|---|---|---|---|
| 1970 | 336.3 lb | 2022 was +37.5 lb, +11.2% | The long view is higher than the early 1970s. |
| 2000 | 425.2 lb | 2022 was -51.4 lb, -12.1% | The 2022 level was below the 2000 peak comparison. |
| 2010 | 399.2 lb | 2022 was -25.4 lb, -6.4% | The 2010 comparison also shows decline. |
| 2019 | 388.6 lb | 2022 was -14.8 lb, -3.8% | The pre-2020 comparison was modestly higher. |
| 2022 | 373.8 lb | Current FADS benchmark in this data pull | Use this as a supply benchmark, separate from intake. |
A statistic can be true and still mislead if the baseline is chosen carelessly. “Vegetable availability is up since 1970” and “vegetable availability is down since 2000” both fit the same USDA series. The honest version names the starting year.
Vegetable Form Statistics – Fresh And Processing Move Differently
Fresh, frozen, canned, and dehydrated vegetables solve separate meal problems. Leafy greens and cucumbers depend on fast turnover. Frozen corn or spinach can sit quietly until a meal needs bulk. Canned tomatoes can turn pasta, beans, soup, and eggs into a vegetable-containing meal without a cutting board.
| Market Form | 1970 | 2000 | 2024 | Change From 2000 To 2024 | Plain-English Read |
|---|---|---|---|---|---|
| Selected fresh vegetables | 92.3 lb/person | 150.9 lb/person | 147.6 lb/person | -3.4 lb, -2.2% | Fresh selected availability stayed close to the 2000 level. |
| Selected processing vegetables | 114.1 lb/person | 123.5 lb/person | 95.2 lb/person | -28.3 lb, -22.9% | Processing availability fell more sharply from 2000. |
Many vegetable consumption claims get thin at the form level. A pound of fresh lettuce, a pound of canned tomatoes, and a pound of frozen broccoli do not deliver the same edible cup, storage life, cooking path, or waste risk. Broader vegetable statistics 2026 for production, prices, and intake help explain the supply side; the consumption side turns on whether those vegetables become actual eating occasions.
For households, the form question is practical. Frozen vegetables can reduce waste when a schedule changes. Canned tomatoes can make vegetables appear in meals that would otherwise skip them. Washed lettuce, cucumbers, and spinach can raise intake when they stay visible. The form that gets eaten has more dietary value than the fresher-looking form that spoils untouched.
Vegetable Consumption By Type – Potatoes And Tomatoes Carry The Weight
Crop mix is the easiest place to overstate variety. In the 2022 USDA ERS fresh-weight-equivalent data, potatoes alone accounted for 110.6 pounds per person, about 29.6% of total vegetable availability. Tomatoes accounted for 75.5 pounds, about 20.2%. Together, potatoes and tomatoes made up nearly half of total availability in that series.
| Rank | Vegetable Type | Availability Per Person | Share Of Total Vegetable Availability | Why It Matters |
|---|---|---|---|---|
| 1 | Potatoes | 110.6 lb | 29.6% | Potatoes dominated the total by weight. |
| 2 | Tomatoes | 75.5 lb | 20.2% | Processed tomato forms heavily shape the total. |
| 3 | Onions | 21.0 lb | 5.6% | Onions led the next tier. |
| 4 | Sweet corn | 16.3 lb | 4.4% | Corn remained ahead of lettuces and cucumbers. |
| 5 | Romaine and leaf lettuce | 12.7 lb | 3.4% | Leaf lettuce added fresh-salad weight. |
| 6 | Cucumbers | 11.1 lb | 3.0% | Cucumbers sat near bell peppers by weight. |
| 7 | Bell peppers | 11.1 lb | 3.0% | Peppers supplied color at a smaller share. |
| 8 | Carrots | 10.6 lb | 2.8% | Carrots remained just above head lettuce. |
| 9 | Head lettuce | 10.3 lb | 2.8% | Head lettuce was below romaine and leaf lettuce. |
| 10 | Broccoli | 7.8 lb | 2.1% | Broccoli had a much smaller national weight share. |
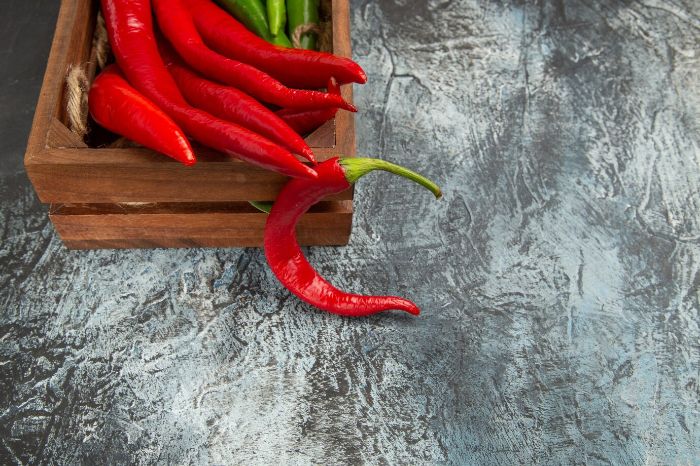
| 11 | Chile peppers | 7.4 lb | 2.0% | Chile peppers sat near broccoli by share. |
| 12 | Sweet potatoes | 5.7 lb | 1.5% | Sweet potatoes were far below white potatoes. |
That does not make potatoes or tomatoes bad. It means the vegetable supply is heavily shaped by forms that fit processing, storage, restaurants, sauces, fries, canned goods, and prepared foods. A colorful produce drawer tells another story from a national availability table.
| Fresh Vegetable | 2024 Availability Per Person | Practical Reading |
|---|---|---|
| Onions | 21.3 lb | The leading selected fresh-market vegetable in this table. |
| Tomatoes | 19.1 lb | Fresh tomatoes were close behind onions. |
| Cucumbers | 8.3 lb | A fresh, high-water crop with shorter storage life. |
| Carrots | 7.1 lb | A durable fresh crop that stores longer than greens. |
| Broccoli | 5.6 lb | A moderate fresh-market share with strong cooking use. |
| Cabbage | 5.5 lb | Close to broccoli, with better storage tolerance. |
| Sweet corn | 4.6 lb | Seasonal and short-lived in fresh form. |
| Spinach | 1.5 lb | A small weight share, even though it is common in salads and cooking. |
Home Garden Consumption Data – Grow What Changes The Meal
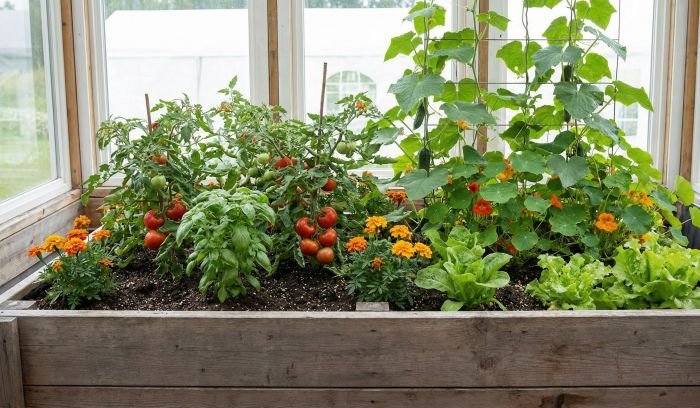
Gardeners can use consumption data without pretending that one raised bed changes national statistics. The household-scale test is smaller: which vegetables already appear often enough that fresh access would change the week? If the answer is salad greens, herbs, cherry tomatoes, peppers, cucumbers, beans, or carrots, the garden has a cleaner path into meals.
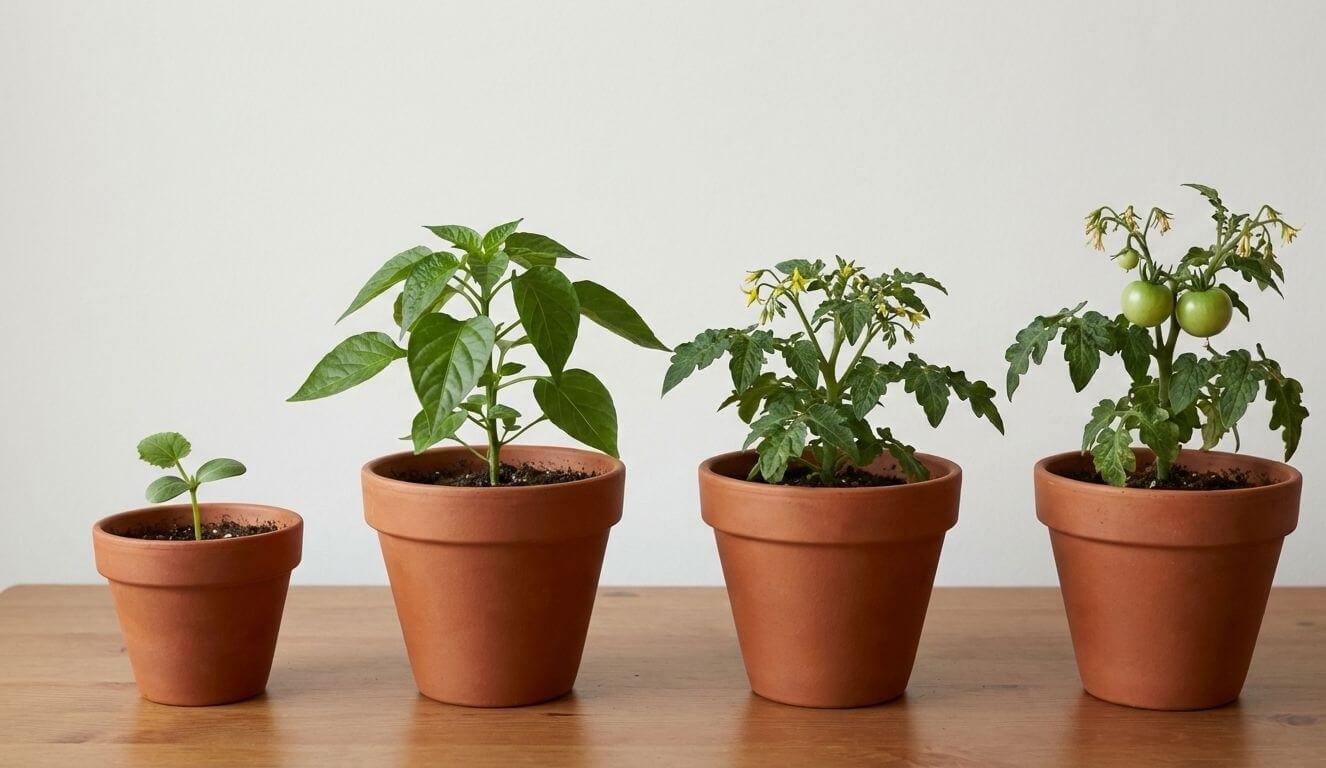
Space and timing decide whether that path holds. A small household may get more real consumption from cut-and-come-again greens than from one heavy crop that arrives all at once. A balcony grower can use container vegetables by size, light, and space to match crops to the site before copying a backyard plan. Root crops, peppers, tomatoes, and greens also need different soil volume, so container depth by vegetable root type can prevent a good consumption idea from failing in the pot.
Field note: Small repeated harvests change meals more reliably than large harvests. A handful of herbs, a bowl of washed lettuce, or four ripe peppers can disappear into dinner. A basket that needs two hours of washing and preserving can sit until the crisp smell turns sour.
Pro Tip: Choose one fresh crop, one cooking crop, and one storage or freezer-friendly crop. For many households, that might mean lettuce or cucumbers, peppers or beans, and tomatoes or herbs for sauce, freezer bags, or cooked meals.
How To Use These Vegetable Statistics Without Misquoting Them
A good citation carries the unit with the number. Percent of adults meeting recommendations, percent of children missing daily vegetables, pounds available per person, and share of total availability are four different measurements. Removing the unit makes the number easier to repeat and easier to misuse.
| Measure | Best Use | Do Not Use It To Claim | Safer Wording |
|---|---|---|---|
| Percent meeting recommendations | Adult intake benchmarking | Exact pounds or cups eaten | “10.0% of adults met vegetable intake recommendations.” |
| Less than daily vegetable frequency | Young child exposure patterns | Serving size or amount eaten | “49.1% of children ages 1-5 did not eat a vegetable daily.” |
| Per-capita availability | Long-term supply comparison | Individual plate consumption | “373.8 pounds were available per person on a fresh-weight-equivalent basis.” |
| Fresh-market availability | Comparing selected fresh crops | Total vegetable diet variety | “Onions led selected fresh-market availability in 2024.” |
| Crop share of total availability | Showing which crops dominate supply weight | Health value or meal quality | “Potatoes and tomatoes carried 49.8% of 2022 availability.” |
Where To Start
A household that wants to eat more vegetables and wastes produce should start with form. Keep one fresh vegetable for quick eating, one frozen vegetable for backup meals, and one canned or stored vegetable for cooking. Track what is empty after two weeks.
Small garden space needs vegetables that match the week more than the seed catalog. Greens, herbs, cherry tomatoes, peppers, cucumbers, and bush beans can raise meal frequency because the harvest comes in usable amounts.
For a school project, report the data type beside the number. Write whether the figure is intake, frequency, availability, fresh-weight equivalent, fresh availability, or processing availability. That one label prevents most bad comparisons.
For later updates, check CDC for new intake surveillance first, then USDA ERS for availability updates. The newest supply number and the newest intake number may come from different years.
Conclusion
Vegetable consumption statistics point to a clear split: U.S. vegetable availability remains large, and most people still fall short of daily intake recommendations. The strongest benchmark is 10.0% of adults meeting vegetable recommendations, paired with the child finding that 49.1% of ages 1-5 did not eat a daily vegetable in the preceding week.
For a household, the practical target is weekly repeatability. Put vegetables where the meal already happens, choose forms that survive the schedule, and grow only the crops that fit light, storage, and appetite. Success looks like an empty container of washed greens, carrots cut before they dry out, and a pan of dinner that gained vegetables without a fight.