Fruit consumption statistics for 2026 show a large gap between fruit available in the food system and fruit likely eaten after retail, household, and edible-weight losses. The latest USDA ERS total fruit availability row shows 237.7 pounds per person in 2021 on a fresh-weight-equivalent basis. Loss-adjusted ERS data, which is closer to intake, shows 108.9 pounds per person, or 0.817 cup-equivalents per day.
That gap is the main signal. Much of the fruit supply sits in forms, losses, and processing channels that translate poorly into daily whole-fruit intake. Fresh fruit made up 58.4 percent of total fruit availability in 2021. Juice alone made up 33.2 percent. Bananas led fresh retail availability. Apples and oranges led the broader fresh-weight-equivalent table once processed forms were included.
Key Takeaways
- Use 237.7 lb/person for total fruit availability.
- Track fresh fruit at 58.4% of availability.
- Count juice at one-third of total fruit availability.
- Compare 0.817 daily cup-equivalents against 2 servings.
- Rank bananas first in fresh retail availability.
Table of Contents
Latest U.S. Fruit Consumption Snapshot
Source: Garden Insider calculations from USDA ERS Food Availability Per Capita Data System. Total fruit availability is latest available 2021. Citrus rows and juice rows extend to 2022 in selected ERS tables. The 2-serving reference comes from the 2025-2030 Dietary Guidelines 2,000-calorie pattern.
U.S. Fruit Consumption Overview – Availability Is Not Intake
The cleanest national measure is USDA ERS per-capita availability. It measures how much fruit is available for consumption after production, imports, exports, and nonfood uses are accounted for. Food diaries and plate-level intake surveys measure a separate behavior.
In 2021, total fruit availability was 237.7 pounds per person on a fresh-weight-equivalent basis. Fresh fruit accounted for 138.8 pounds. Processed fruit accounted for 99.0 pounds. The loss-adjusted table tells a smaller daily story: 108.9 pounds per person per year, or 4.77 ounces per day, remained after ERS food-loss adjustments.
| Fruit measure | Latest value | Year | Unit | What it means |
|---|---|---|---|---|
| Total fruit availability | 237.7 | 2021 | lb/person/year | Food supply, fresh-weight equivalent |
| Fresh fruit availability | 138.8 | 2021 | lb/person/year | Fresh fruit before loss adjustment |
| Processed fruit availability | 99.0 | 2021 | lb/person/year | Juice, canned, frozen, dried, and other processed fruit |
| Loss-adjusted fruit availability | 108.9 | 2021 | lb/person/year | Closer to food actually eaten |
| Food-pattern equivalents | 0.817 | 2021 | cups/person/day | Daily fruit-equivalent availability after loss adjustment |
The fruit production statistics show how much fruit U.S. farms produce. Consumption statistics show how fruit moves through food availability, processing, and loss-adjusted intake estimates.
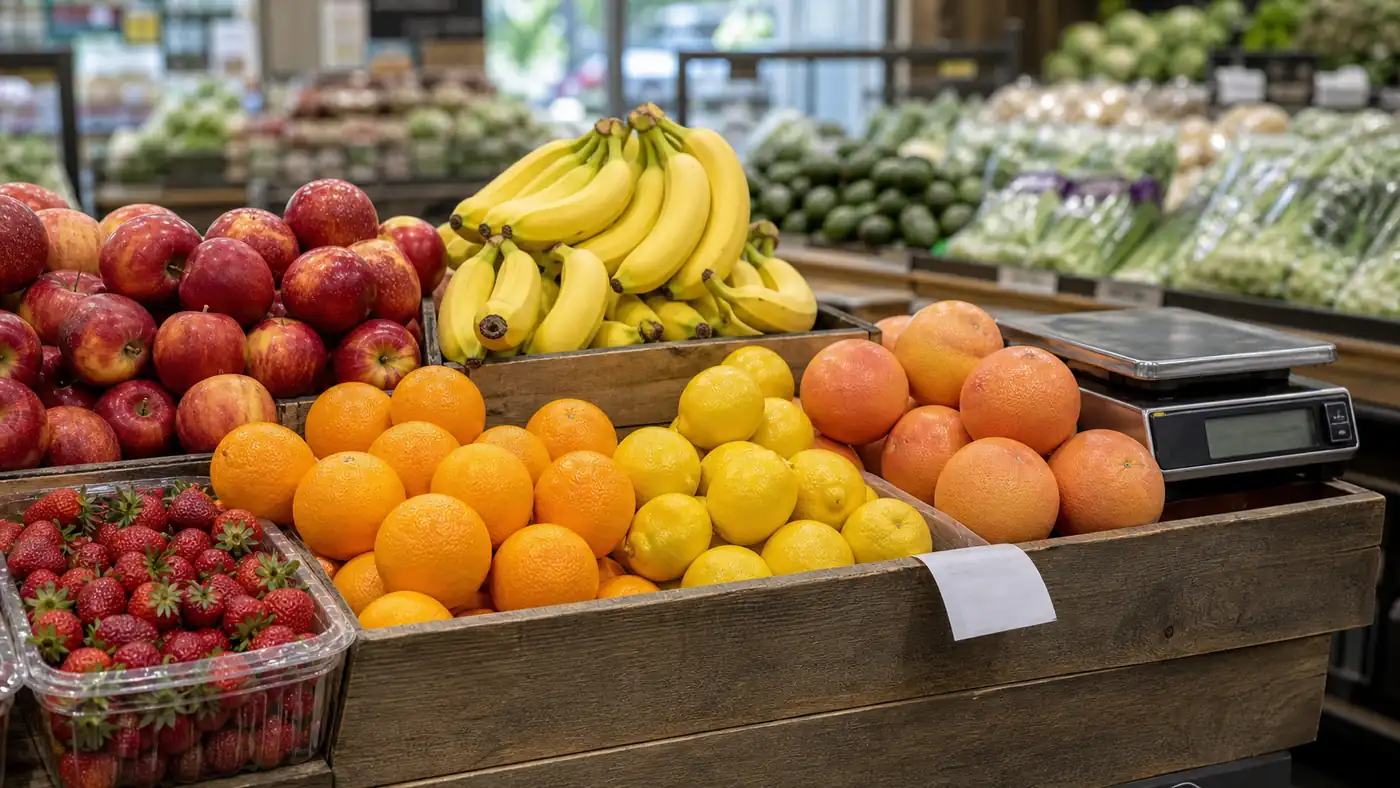
Fresh Fruit Consumption – Bananas Lead Retail Availability
Fresh fruit availability is led by bananas. ERS fresh fruit retail availability put bananas at 26.9 pounds per person in 2021. Apples ranked second at 15.2 pounds, followed by watermelon at 13.0 pounds. Fresh oranges reached 8.0 pounds per person in 2022, the latest citrus row in the fresh fruit file.
Production and consumption use separate lenses. Grapes are the top U.S. fruit crop by production value, yet fresh grapes ranked below bananas, apples, watermelon, oranges, avocados, and pineapples in the latest fresh retail availability rows. Imports, storage, processing use, and retail demand all reshape what consumers encounter.
| Rank | Fresh fruit | Latest retail availability | Year | Reading note |
|---|---|---|---|---|
| 1 | Bananas | 26.9 lb/person | 2021 | Largest fresh fruit availability row |
| 2 | Apples | 15.2 lb/person | 2021 | Strong fresh crop and storage crop |
| 3 | Watermelon | 13.0 lb/person | 2021 | High fresh weight from water-heavy fruit |
| 4 | Oranges and temples | 8.0 lb/person | 2022 | Latest citrus row extends one year later |
| 5 | Avocados | 7.9 lb/person | 2021 | High-demand imported and domestic fresh fruit |
| 6 | Grapes | 7.7 lb/person | 2021 | Fresh table grapes only |
| 7 | Pineapples | 7.5 lb/person | 2021 | Import-heavy fresh fruit |
| 8 | Strawberries | 6.7 lb/person | 2021 | High-value berry with short shelf life |
| 9 | Tangerines and tangelos | 5.7 lb/person | 2022 | Latest citrus row |
| 10 | Cantaloupe | 4.7 lb/person | 2021 | Melon category with seasonal pressure |
Fresh rankings also show practical crop constraints. A stored apple behaves separately from a soft berry or a cluster of table grapes. Homegrown apple trees and growing blueberries need crop-specific planning because the consumption category hides separate growing systems.
Total Fruit Availability – Apples, Oranges, And Bananas Dominate
The all-uses fresh-weight-equivalent table changes the crop order because processed forms are included. Apples and oranges each reached about 45.9 pounds per person in 2021. Bananas followed at 26.9 pounds. Watermelon, pineapple, grapes, tangerines, lemons, strawberries, and avocados made up the next tier.
Processed uses lift the apple and orange totals far above their fresh-only rows. Apple juice, canned apples, applesauce, dried apples, and orange juice all push those all-use rows above fresh retail availability alone.
| Rank | Fruit, all uses | 2021 availability | Share of total fruit availability | Main reason it ranks high |
|---|---|---|---|---|
| 1 | Apples | 45.9 lb/person | 19.3% | Fresh plus processed apple products |
| 2 | Oranges and temples | 45.9 lb/person | 19.3% | Fresh oranges plus orange juice |
| 3 | Bananas | 26.9 lb/person | 11.3% | Largest fresh fruit row |
| 4 | Watermelon | 14.4 lb/person | 6.1% | High fresh weight |
| 5 | Pineapple | 14.2 lb/person | 6.0% | Fresh and processed forms |
| 6 | Grapes | 12.0 lb/person | 5.1% | Fresh grapes, raisins, and juice/wine-related use |
| 7 | Tangerines and tangelos | 9.4 lb/person | 3.9% | Fresh citrus growth |
| 8 | Lemons | 9.2 lb/person | 3.9% | Fresh and juice use |
| 9 | Strawberries | 9.2 lb/person | 3.9% | Fresh and frozen demand |
| 10 | Avocados | 8.5 lb/person | 3.6% | Fresh avocado demand |
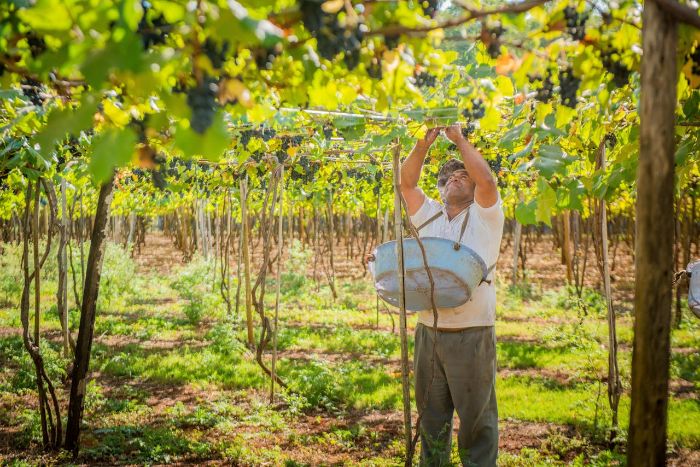
Grapes are a useful example. The grape vine training work that raises reliable fruit at home is only one small slice of the crop’s national use. Commercial grapes also move into wine, raisins, and juice channels.
Fresh Versus Processed Fruit – Juice Carries Most Processed Volume
Fresh fruit accounted for 138.8 pounds per person in 2021, or 58.4 percent of total fruit availability. Processed fruit accounted for 99.0 pounds, or 41.6 percent. Juice was by far the largest processed category at 79.0 pounds per person, equal to 33.2 percent of total fruit availability.
Canned fruit, frozen fruit, dried fruit, and other processed fruit were much smaller. Canned fruit accounted for 11.3 pounds per person, frozen fruit 5.0 pounds, dried fruit 3.0 pounds, and other processed apples 0.7 pounds.
| Fruit form | 2021 availability | Share of total fruit availability | What it includes |
|---|---|---|---|
| Fresh fruit | 138.8 lb/person | 58.4% | Fresh citrus and noncitrus fruit |
| Total processed fruit | 99.0 lb/person | 41.6% | Juice, canned, frozen, dried, and other processed fruit |
| Juice | 79.0 lb/person | 33.2% | Fresh-weight-equivalent juice |
| Canned fruit | 11.3 lb/person | 4.7% | Canned fruit products |
| Frozen fruit | 5.0 lb/person | 2.1% | Frozen fruit products |
| Dried fruit | 3.0 lb/person | 1.3% | Dried fruit products |
The processed split is one reason a simple “fruit consumption” number can mislead. Juice availability increases fruit-equivalent pounds. Whole-fruit eating depends on fresh access, storage, preparation habits, and waste at home.
Loss-Adjusted Fruit Intake – The Daily Number Is Smaller
ERS loss-adjusted fruit availability was 108.9 pounds per person in 2021. That works out to 4.77 ounces per day, 135.3 grams per day, and 0.817 food-pattern cup-equivalents per day. ERS estimated total fruit loss across all levels at 54.0 percent.
The 2025-2030 Dietary Guidelines 2,000-calorie pattern uses 2 fruit servings per day as the reference amount. Against that pattern, 0.817 daily cup-equivalents represents 40.8 percent of the 2-serving reference. This is a population-level availability measure after ERS loss adjustments, not an individual compliance rate.
| Loss-adjusted fruit metric | 2021 value | Unit | Interpretation |
|---|---|---|---|
| Primary fruit availability | 236.9 | lb/person/year | Broad supply-side weight |
| Loss-adjusted availability | 108.9 | lb/person/year | Closer to eating after food-loss adjustment |
| Daily loss-adjusted amount | 4.77 | oz/person/day | Daily weight equivalent |
| Daily loss-adjusted amount | 135.3 | g/person/day | Metric daily equivalent |
| Food-pattern equivalents | 0.817 | cups/person/day | Comparable to fruit group guidance |
| Total loss, all levels | 54.0% | percent | ERS estimated loss from supply to edible use |
The source for the guidance comparison is the 2025-2030 Dietary Guidelines for Americans. The key point is scale: national fruit-equivalent availability after losses is well below a 2-serving daily reference pattern.
Fruit Consumption Trend – Total Availability Is Below The 2000 Peak
Total fruit availability peaked in the selected ERS trend years at 286.7 pounds per person in 2000. By 2010, it had dropped to 253.7 pounds. In 2020, it was 231.4 pounds, then rose to 237.7 pounds in 2021. The 2021 value was close to the 1970 level of 238.0 pounds, despite major changes in fruit imports, storage, retail access, and year-round availability.
The form of fruit changed across the trend. Fresh fruit availability rose from 100.6 pounds in 1970 to 138.8 pounds in 2021. Juice availability moved from 96.7 pounds in 1970 to 79.0 pounds in 2021 after a much higher period around 1980-2000.
| Year | Total fruit availability | Fresh fruit | Juice | Trend signal |
|---|---|---|---|---|
| 1970 | 238.0 lb/person | 100.6 lb | 96.7 lb | Baseline near 2021 total |
| 1980 | 265.3 lb/person | 106.4 lb | 119.7 lb | High juice contribution |
| 1990 | 270.8 lb/person | 117.1 lb | 115.8 lb | Total remained elevated |
| 2000 | 286.7 lb/person | 127.3 lb | 126.5 lb | Peak in selected years |
| 2010 | 253.7 lb/person | 126.3 lb | 97.2 lb | Total and juice declined |
| 2020 | 231.4 lb/person | 139.4 lb | 72.2 lb | Fresh high, juice lower |
| 2021 | 237.7 lb/person | 138.8 lb | 79.0 lb | Total recovered slightly |
The trend moves in more than one direction. Total availability is lower than the 2000 level. Fresh availability is higher than in 1970. Juice has lost much of its earlier weight in the total.
Fruit Juice Consumption – Orange Juice Still Dominates Juice Rows
ERS selected fruit juice data extends to 2022 for some rows. Orange juice availability was 2.12 gallons per person in 2022 on a single-strength basis. Grapefruit juice was much smaller at 0.064 gallons per person. Orange juice also represented 40.5 pounds per person in fresh-weight-equivalent oranges and temples in the all-uses table.
Juice is useful for measuring fruit supply. It is a weak proxy for whole-fruit eating because it removes the texture, chewing, and much of the whole-fruit satiety signal that people get from a crisp apple, a bowl of berries, or a wedge of watermelon. That physical gap matters when the research question is eating behavior rather than commodity flow.
| Juice row | Latest value | Year | Unit | What it shows |
|---|---|---|---|---|
| Orange juice | 2.12 | 2022 | gallons/person | Largest selected juice row |
| Orange juice | 18.46 | 2022 | lb/person, single-strength | Product-weight equivalent |
| Orange juice fresh-weight equivalent | 40.48 | 2022 | lb/person | Fresh oranges and temples equivalent |
| Grapefruit juice | 0.064 | 2022 | gallons/person | Small selected juice row |
Citrus consumption also ties back to growing constraints. A gardener can grow citrus in the right climate or container setup. The national consumption row is shaped by juice markets, imports, and packinghouse channels. Growing citrus for vitamin C covers the plant side of a much larger consumption system.
Source And Methodology Notes
The main source is the USDA ERS Food Availability Per Capita Data System. Total fruit, fresh fruit, and processed fruit figures use the fruit all-uses table where total fruit rows are available through 2021. Selected citrus and juice rows extend to 2022 in the detailed ERS fruit files.
Availability and individual food diaries measure separate things. ERS availability starts with the food supply. Loss-adjusted availability applies food-loss assumptions across retail, foodservice, household, edible weight, cooking loss, and uneaten food. That makes loss-adjusted data closer to intake, still at population level.
| Claim type | Primary source | Latest period used | Measurement | Confidence note |
|---|---|---|---|---|
| Total fruit availability | USDA ERS Food Availability | 2021 | lb/person/year, fresh-weight equivalent | Official food supply data |
| Fresh and processed shares | USDA ERS fruit all-uses table | 2021 | lb/person/year and share of total | Calculated from ERS rows |
| Loss-adjusted intake estimate | USDA ERS loss-adjusted fruit table | 2021 | lb/year, oz/day, grams/day, cups/day | Population-level estimate after food-loss assumptions |
| Fresh fruit rankings | USDA ERS fresh fruit supply-and-use tables | 2021 or 2022 for selected citrus | retail lb/person | Latest realistic year by commodity row |
| Dietary comparison | 2025-2030 Dietary Guidelines for Americans | 2025-2030 pattern | 2 fruit servings/day reference | Reference pattern |
Where To Start With The Data
Nutrition research starts with the loss-adjusted row. The 0.817 cup-equivalents per day figure is the closest ERS estimate to fruit actually eaten after food-loss assumptions.
Retail research starts with fresh availability. Bananas, apples, watermelon, oranges, avocados, grapes, pineapples, and strawberries show which fresh fruits matter most by retail availability.
Supply-chain research starts with the all-uses table. Apples and oranges look much larger there because juice and processed fruit turn fresh-weight-equivalent supply into a broader consumption measure.
Conclusion
The strongest 2026 fruit consumption signal is the gap between supply and likely intake. Total fruit availability was 237.7 pounds per person in 2021. Loss-adjusted fruit availability was 108.9 pounds. In daily terms, ERS estimated 0.817 cup-equivalents per person, far below the 2-serving reference in the 2,000-calorie Dietary Guidelines pattern.
The second signal is form. Fresh fruit makes up most fruit availability. Juice still carries one-third of the total. Bananas lead fresh retail availability, and apples and oranges rise in the all-uses table because processed forms matter. Strong citations name the measure first: total availability, fresh retail availability, juice, or loss-adjusted intake.
Frequently Asked Questions
How much fruit do Americans consume per year?
The latest USDA ERS total fruit availability row shows 237.7 pounds per person in 2021 on a fresh-weight-equivalent basis. The loss-adjusted estimate is lower at 108.9 pounds per person per year.
What is the most consumed fresh fruit in the United States?
Bananas are the top fresh fruit by latest ERS retail availability, at 26.9 pounds per person in 2021. Apples ranked second at 15.2 pounds per person.
How much fresh fruit is available per person?
Fresh fruit availability was 138.8 pounds per person in 2021, according to USDA ERS. That was 58.4 percent of total fruit availability on a fresh-weight-equivalent basis.
How much fruit juice do Americans consume?
Fruit juice accounted for 79.0 pounds per person in 2021 on a fresh-weight-equivalent basis. In the selected 2022 juice rows, orange juice availability was 2.12 gallons per person.
Does fruit availability equal actual fruit intake?
No. Availability measures supply available for consumption. Loss-adjusted availability estimates what remains after retail, foodservice, household, edible-weight, cooking, and uneaten-food losses. It is closer to intake and still works as a population-level estimate, not a food diary.