Fruit price statistics for 2026 show a mild retail increase at the basket level, with sharper movement inside apples, citrus, frozen fruit, lemons, and strawberries. Fresh fruit CPI was 2.1 percent higher in May 2026 than in May 2025, based on Bureau of Labor Statistics data, and USDA ERS forecast fresh fruit prices to rise 1.8 percent across 2026.
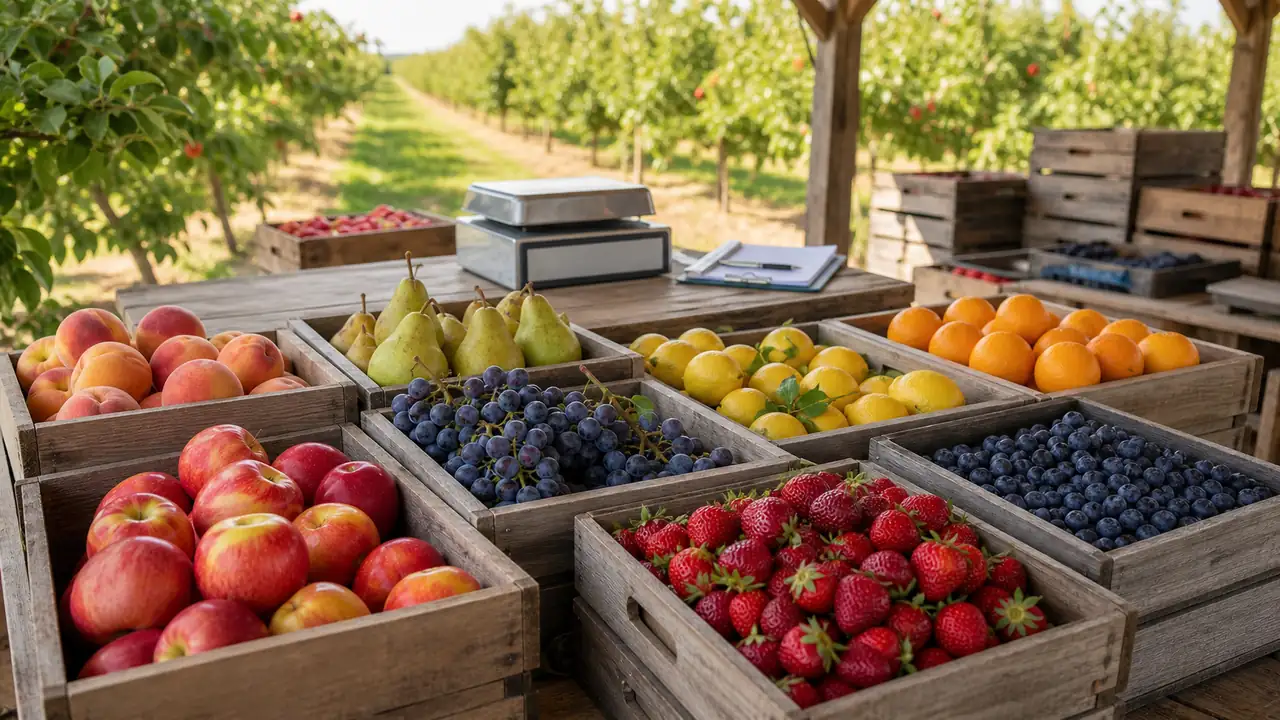
The main split is between the grocery shelf and the farm gate. Retail fresh fruit prices are still rising, and farm-level fruit prices were forecast to fall 6.3 percent in 2026. A shopper sees a bin of oranges, lemons, apples, and berries under small price tags; the data behind that display is a stack of freight, storage, imports, shrink, promotions, and crop timing.
Key Takeaways
- Track fresh fruit CPI at +2.1% year over year.
- Use +1.8% as USDA’s 2026 fresh fruit forecast.
- Separate retail inflation from farm-level fruit deflation.
- Watch citrus CPI at +6.1% in May 2026.
- Compare lemons and strawberries before quoting average prices.
Table of Contents
2026 U.S. Fruit Price Snapshot
Sources: Garden Insider calculations from BLS CPI public API series through May 2026 and USDA ERS Food Price Outlook published May 2026. CPI rows show 12-month change in non-seasonally adjusted U.S. city average indexes.
U.S. Fruit Price Snapshot – Retail Is Rising Slowly
The cleanest 2026 signal is mild retail pressure. The BLS fresh fruits CPI index reached 426.639 in May 2026, up 2.1 percent from May 2025 and up 1.9 percent from January 2026. That national index covers the fresh fruit basket, so it smooths together apples, bananas, citrus, berries, melons, grapes, and other fresh fruit.
The USDA ERS Food Price Outlook gave a similar retail reading from its May 2026 forecast cycle: fresh fruit prices rose 1.2 percent from March to April 2026 and were 2.1 percent higher than April 2025. ERS forecast a 1.8 percent fresh fruit price increase for the full 2026 calendar year, with a prediction interval from -0.9 percent to +4.7 percent.
| 2026 price measure | Latest value | Period | Measurement | Source |
|---|---|---|---|---|
| Fresh fruits CPI | +2.1% | May 2026 vs May 2025 | 12-month CPI change | BLS public API, CUUR0000SEFK |
| Fresh fruits CPI | +1.9% | May 2026 vs January 2026 | Year-to-date CPI index change | BLS public API, CUUR0000SEFK |
| Fresh fruit retail prices | +1.2% | April 2026 vs March 2026 | Monthly CPI movement cited by ERS | USDA ERS Food Price Outlook |
| Fresh fruit retail prices | +1.8% | 2026 forecast | Annual CPI forecast | USDA ERS Food Price Outlook |
| Fresh fruit forecast range | -0.9% to +4.7% | 2026 forecast | USDA prediction interval | USDA ERS Food Price Outlook |
For researchers, the usable line is this: 2026 fruit inflation is real, and the national fresh fruit basket is moving more gently than eggs, beef, or fresh vegetables. The pressure is category-specific, and that is where the clearest citations sit.
Fresh Fruit CPI – Apples And Citrus Carry The Increase
The May 2026 BLS CPI split shows stronger movement inside the basket. Apples were up 5.6 percent from May 2025. Citrus fruit was up 6.1 percent. Bananas went the opposite direction, down 1.2 percent from a year earlier, and other fresh fruit moved only 0.9 percent.
That mix explains why the all-fresh-fruit CPI looks calmer than a shopper’s memory of one expensive item. A family buying lemons, oranges, and apples feels a separate price pattern from a shopper buying bananas and seasonal melon. Fruit price statistics need crop-level rows because the basket average hides the item people actually put in the cart.
| Fruit CPI category | May 2026 index | Change from May 2025 | Change from January 2026 | Reading note |
|---|---|---|---|---|
| Fresh fruits | 426.639 | +2.1% | +1.9% | Basket-level fresh fruit inflation |
| Apples | 378.198 | +5.6% | +8.9% | Strongest year-to-date move in this CPI set |
| Bananas | 214.350 | -1.2% | -0.9% | Lower than both January 2026 and May 2025 |
| Citrus fruits | 308.922 | +6.1% | +4.9% | Sharpest 12-month rise among fresh fruit subgroups |
| Other fresh fruits | 146.110 | +0.9% | +0.1% | Nearly flat basket outside apples, bananas, and citrus |
| Processed fruits | 211.778 | +3.0% | +1.1% | Processed fruit prices rising faster than fresh fruit |
| Frozen fruits | 225.049 | +7.1% | +1.9% | High 12-month increase in the frozen fruit row |
The fruit consumption statistics help explain why bananas matter so much in the retail story. Bananas lead fresh fruit availability, so a lower banana price can pull against higher apple and citrus indexes in the broader fresh fruit basket.
Average Retail Fruit Prices – Bananas Remain The Cheap Anchor
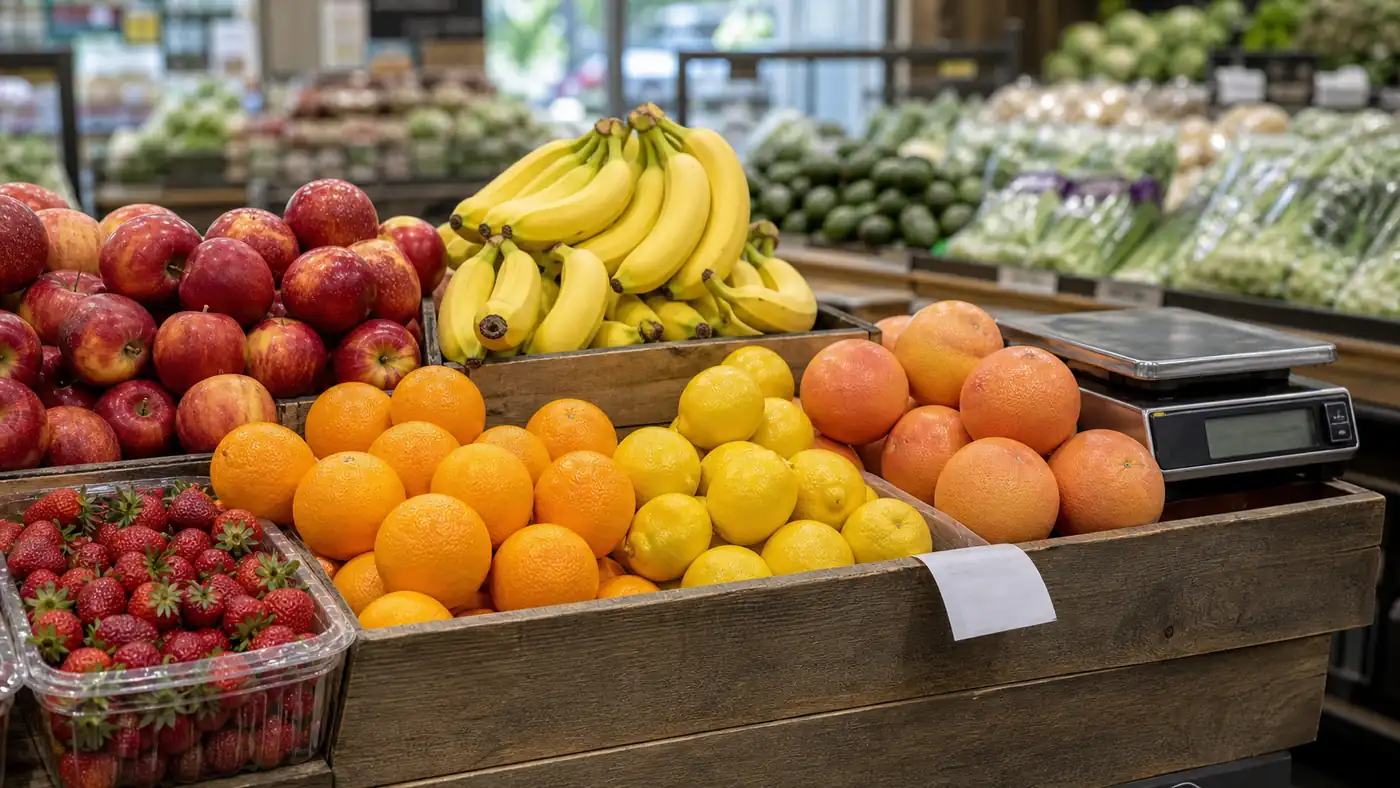
CPI shows price change. Average price data shows the price a shopper can picture. In the BLS U.S. city average series for May 2026, bananas averaged $0.646 per pound. Navel oranges averaged $1.542 per pound, grapefruit averaged $1.595 per pound, lemons averaged $2.091 per pound, and strawberries averaged $2.595 per dry pint.
Those units matter. A pound of bananas is not the same shopping unit as a dry pint of strawberries. The comparison is still useful because it shows which fruit acts as the low-cost base and which fruit behaves like a higher-price add-on. Bananas sit under $0.70 per pound in the May 2026 BLS row. Lemons and strawberries sit in a separate price tier.
| Fruit item | May 2026 average price | Unit | Change from May 2025 | Change from January 2026 |
|---|---|---|---|---|
| Bananas | $0.646 | per pound | -1.4% | -1.1% |
| Navel oranges | $1.542 | per pound | -1.4% | +0.4% |
| Grapefruit | $1.595 | per pound | -4.8% | +1.1% |
| Lemons | $2.091 | per pound | +10.2% | +6.1% |
| Strawberries | $2.595 | per dry pint | +8.3% | -15.6% |
Strawberries show why month choice matters. The May 2026 average price was 8.3 percent higher than May 2025 and 15.6 percent lower than January 2026. Seasonal supply can pull a berry price down sharply inside the year even when the same item remains higher than the prior May.
Farm-Level Fruit Prices – Retail And Farm Data Split
Retail fruit prices rose in the 2026 forecast. Farm-level fruit prices moved down. ERS reported that farm-level fruit prices rose 4.3 percent from March 2026 to April 2026 and were still 6.4 percent lower than April 2025. The full-year 2026 forecast called for a 6.3 percent decline in farm-level fruit prices, with a prediction interval from -15.2 percent to +4.2 percent.
That split is one of the most useful citation points in the price story. A lower farm-level price does not pass through to the grocery shelf one-for-one. Fresh fruit retail prices carry cold chain handling, grading, packing, freight, store labor, shrink, promotions, and margin. A soft peach, bruised apple, or leaky berry clamshell has a cost even before a shopper picks it up.
| Farm-level fruit measure | Value | Period | Measurement | What it means |
|---|---|---|---|---|
| Farm-level fruit prices | +4.3% | April 2026 vs March 2026 | Monthly price movement | Short-term rebound at the farm stage |
| Farm-level fruit prices | -6.4% | April 2026 vs April 2025 | 12-month movement | Farm-stage prices below the prior year |
| Farm-level fruit prices | -6.3% | 2026 forecast | Annual price forecast | ERS expects lower farm-level fruit prices in 2026 |
| Farm-level fruit forecast range | -15.2% to +4.2% | 2026 forecast | USDA prediction interval | Wide uncertainty around the farm-stage forecast |
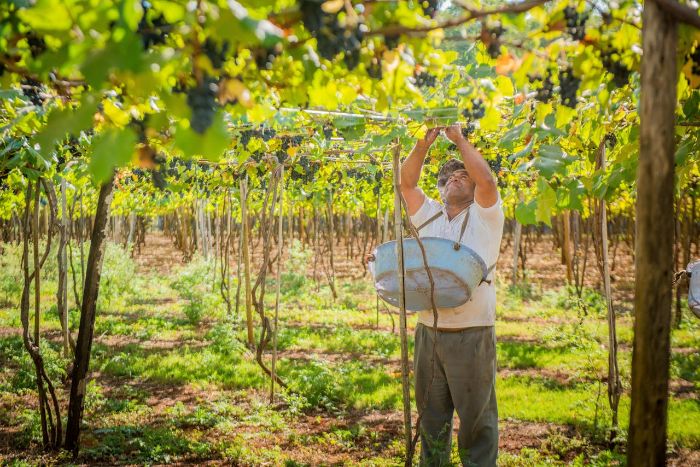
The production side gives that farm-stage data context. The fruit production statistics show apples and grapes carrying just over half of the latest combined U.S. fruit tonnage, with citrus on a separate crop-year calendar. Price movement is not one national fruit crop moving together.
Fruit Price Forecast – 2026 Looks Milder Than Food At Home
USDA ERS forecast all food prices to rise 3.4 percent in 2026 and food-at-home prices to rise 3.2 percent. Fresh fruit’s 1.8 percent forecast sits below both numbers. Processed fruits and vegetables, a combined ERS category, were listed among the food-at-home categories forecast to grow faster than their 20-year historical average rate.
Fresh fruit therefore sits in the middle of the grocery inflation picture. It is not flat, and it is not the sharpest food category. The better research angle is the spread inside fruit: citrus and apples above the basket, bananas below it, frozen fruit high on a 12-month CPI basis, and farm-level fruit moving down.
| ERS 2026 forecast category | Forecast change | Prediction interval | How fruit compares |
|---|---|---|---|
| All food | +3.4% | +2.2% to +4.7% | Fresh fruit is forecast below this rate |
| Food at home | +3.2% | +1.3% to +5.2% | Fresh fruit is forecast below grocery inflation |
| Fresh fruit | +1.8% | -0.9% to +4.7% | Mild increase with a wide range |
| Farm-level fruit | -6.3% | -15.2% to +4.2% | Opposite direction from retail fresh fruit |
Home gardeners should not read the forecast as a reason to grow every fruit. Space, climate, and years-to-harvest change the economics fast. A container of blueberries in acidic soil or a carefully chosen apple tree can make sense for a household. Replacing the grocery fruit basket is a much larger project.
Source And Methodology Notes – How To Read The Numbers
Fruit price data uses several measurement systems. CPI indexes measure price change over time, not dollars per pound. BLS average price series show selected retail items in familiar units. ERS forecasts estimate annual price change across a calendar year. Farm-level forecasts describe producer-stage prices, not retail checkout prices.
| Data source | Dataset or release | Latest period used | Measurement type | Best use |
|---|---|---|---|---|
| USDA ERS | Food Price Outlook summary findings | May 2026 forecast cycle | CPI and farm-level price forecasts | Forecasts and retail/farm split |
| BLS | Public Data API, CUUR0000SEFK | May 2026 | Fresh fruits CPI index | Basket-level price inflation |
| BLS | Public Data API, CUUR0000SEFK01 through CUUR0000SEFK04 | May 2026 | Apples, bananas, citrus, other fresh fruit CPI indexes | Category-level CPI comparisons |
| BLS | Public Data API, APU fruit average price series | May 2026 | Average retail prices in dollars per unit | Item-level shopper-facing prices |
| USDA AMS | National Retail Report – Specialty Crops | June 2026 weekly report | Advertised retail promotion signal | Current ad-market context, not CPI |
October 2025 BLS rows were unavailable in the API response because of the 2025 lapse in appropriations. The year-over-year May 2026 calculations do not use October data, so those gaps do not affect the May-to-May percentages reported here.
Where To Start
A quick citation about fruit inflation should start with fresh fruits CPI. Use the May 2026 BLS year-over-year value of +2.1 percent, then state that USDA ERS forecast fresh fruit prices to rise 1.8 percent across 2026.
For a crop-level price comparison, use more than the fresh fruit basket. Quote apples at +5.6 percent, citrus at +6.1 percent, bananas at -1.2 percent, and other fresh fruits at +0.9 percent from May 2025 to May 2026.
Shopper-facing price examples need BLS average price units. Bananas were $0.646 per pound in May 2026, lemons were $2.091 per pound, and strawberries were $2.595 per dry pint.
Farm-to-retail claims need ERS farm-level fruit data. Retail fresh fruit was forecast up 1.8 percent in 2026, and farm-level fruit was forecast down 6.3 percent.
Conclusion
Fruit prices in 2026 are not moving as one clean basket. Fresh fruit CPI is up 2.1 percent year over year through May, USDA ERS forecasts a 1.8 percent annual increase, and farm-level fruit prices are forecast to fall 6.3 percent. The useful signal is the split by fruit and by stage.
Use the fresh fruit CPI for the top-line number, apples and citrus for the sharper retail pressure, bananas for the low-price anchor, and farm-level fruit for the supply-chain split. The grocery display may look calm from a few steps away; the individual price tags tell the story.
Frequently Asked Questions
Are fruit prices going up in 2026?
Yes. USDA ERS forecast fresh fruit prices to rise 1.8 percent in 2026, and BLS fresh fruits CPI was 2.1 percent higher in May 2026 than in May 2025. The increase is mild at the basket level.
Which fruit prices are rising fastest in 2026?
In the May 2026 BLS CPI data, citrus fruits rose 6.1 percent year over year and apples rose 5.6 percent. Frozen fruit rose 7.1 percent, using a separate processed/frozen fruit CPI row.
Are banana prices rising in 2026?
No, not in the latest BLS national rows used here. Bananas averaged $0.646 per pound in May 2026, down 1.4 percent from May 2025, and the banana CPI index was down 1.2 percent year over year.
Why can farm fruit prices fall as retail fruit prices rise?
Farm-level prices measure the producer stage. Retail prices include packing, cold storage, freight, store labor, shrink, and margin. ERS forecast farm-level fruit prices down 6.3 percent in 2026, and fresh fruit retail prices were forecast up 1.8 percent.
What is the best source for fruit price statistics?
Use USDA ERS for forecasts and farm-level context, BLS CPI for price inflation, and BLS average price series for selected retail items such as bananas, oranges, grapefruit, lemons, and strawberries.